
Fig. 1.
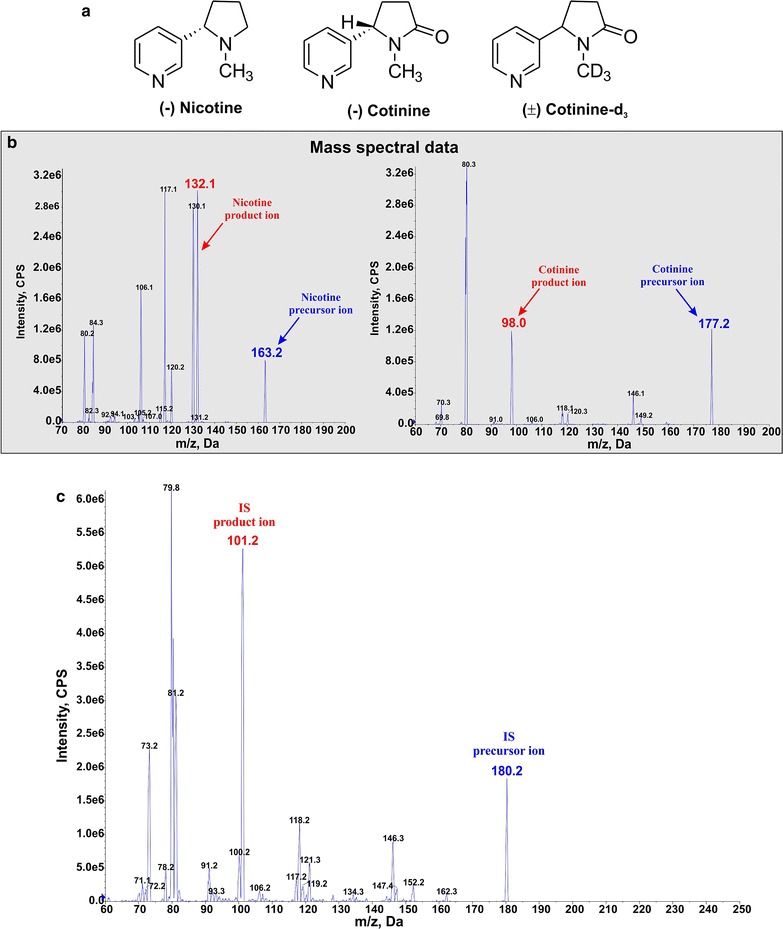
Mass spectral data and representative peaks. Chemical structure of analytes and IS (a), mass spectral data of nicotine and cotinine (b). c Mass spectral data for the Internal Standards
Official websites use .gov
A
.gov website belongs to an official
government organization in the United States.
Secure .gov websites use HTTPS
A lock (
) or https:// means you've safely
connected to the .gov website. Share sensitive
information only on official, secure websites.
Mass spectral data and representative peaks. Chemical structure of analytes and IS (a), mass spectral data of nicotine and cotinine (b). c Mass spectral data for the Internal Standards