
Fig. 3.
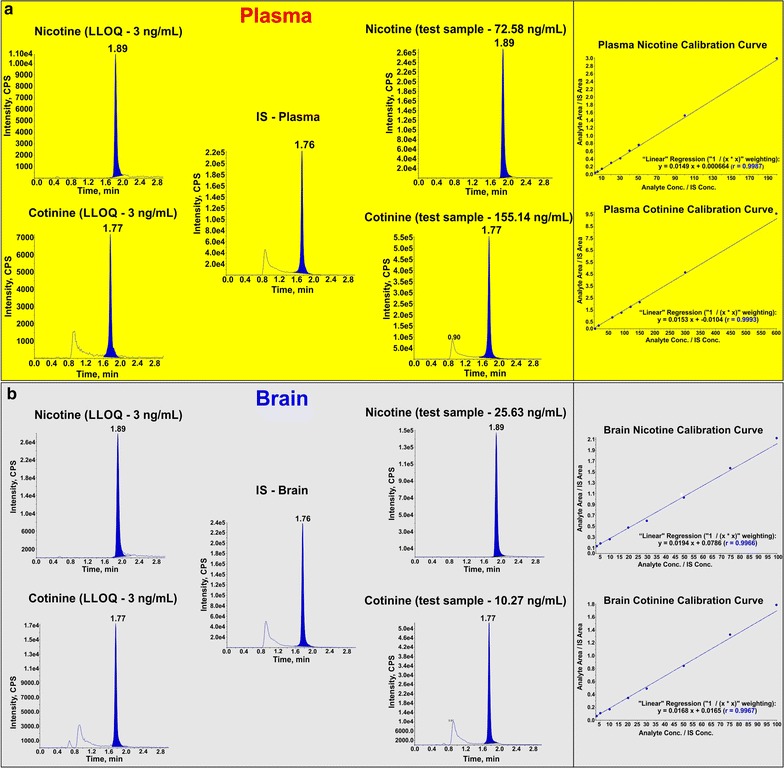
Representative peaks and calibration curves. Representative peaks of analytes (QC sample) at LLOQ (3 ng/mL), IS (20 ng/mL) and test samples in plasma (a) and brain (b) matrix. Note also the calibration curves for nicotine-plasma (3–200 ng/mL), cotinine-plasma (3–600 ng/mL), nicotine-brain (3–100 ng/mL) and cotinine (3–100 ng/mL) with r > 0.99