
Fig. 4.
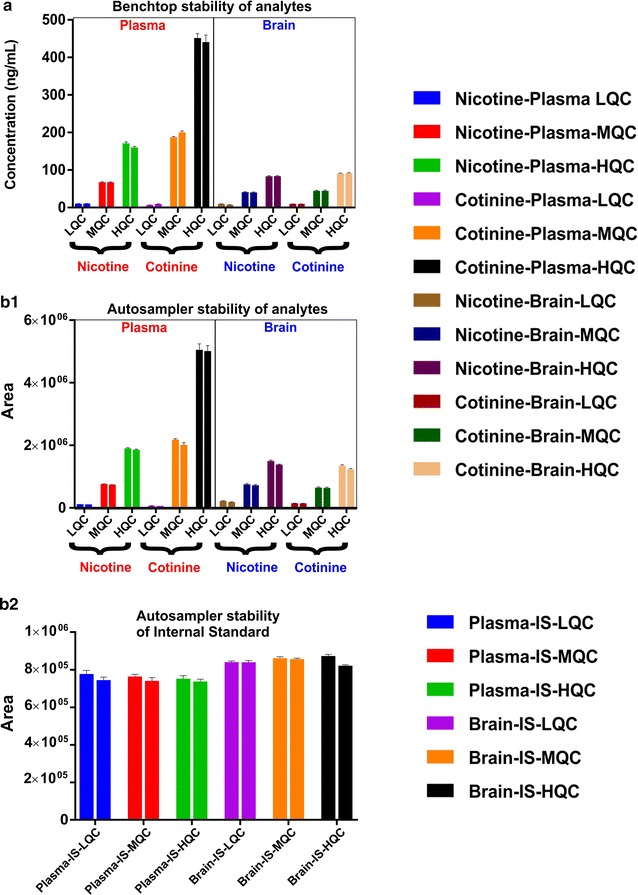
Benchtop and auto-sampler stability assay. Benchtop stability-Adjacent/grouped/paired columns (two columns with identical color) represent concentrations of control/non-stressed sample (measured immediately after sample preparation, first column) vs concentrations of stability/stressed sample (samples left at ambient temperature for 10 h prior to analysis-benchtop delayed, second column). No statistical difference in concentrations (between two adjacent columns) displays benchtop stability at LQC, MQC and HQC concentrations in both plasma and brain (a). Autosampler stability—Adjacent/grouped/paired columns (two columns with identical color) represent absolute peak area of control/non-stressed sample (measured immediately after sample preparation, first column) vs absolute peak area of stability/stressed sample (samples left at autosampler for 12 h prior to analysis, second column). No statistical difference in absolute peak areas (between two adjacent columns) shows autosampler stability of analytes- nicotine and cotinine (b1) and IS (b2) at LQC, MQC and HQC in both plasma and brain