
Fig. 5.
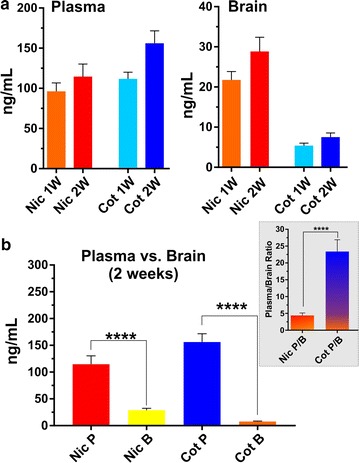
Plasma and brain levels of nicotine and cotinine in mouse. Nicotine and cotinine concentrations in mouse plasma and brain one and 2 weeks post exposure to TS (a). Plasma versus brain level and plasma : brain ratio of nicotine and cotinine 2 weeks post exposure to TS. **** p < 0.0001 plasma concentration of analytes against corresponding brain level, plasma:brain ratio of nicotine against plasma:brain ratio of cotinine (b)