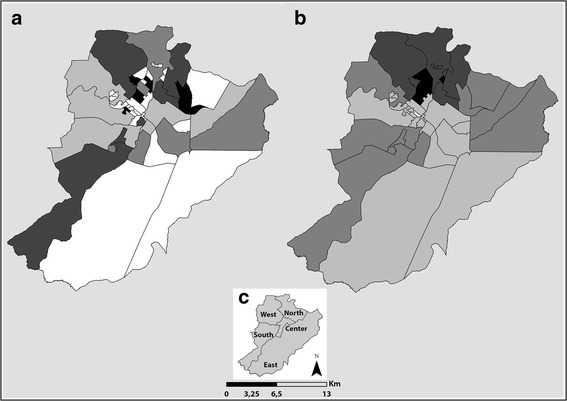
Fig. 2.

Distribution of mortality before and after using the local empirical Bayesian method. Part (a) Gross mortality rate from tuberculosis per 100,000 people.  0.0,
0.0,  0.01–0.89,
  0.90–2.07,
  2.08–2.71,
  2.72–5.93. Part (b) Bayesian mortality rate from tuberculosis per 100,000 people.
  0.0,
0.0,  0.01–0.83,
  0.84–1.67,
  1.68–2.04,
  2.05–2.82. Part (c) Health District
