
Fig. 2.
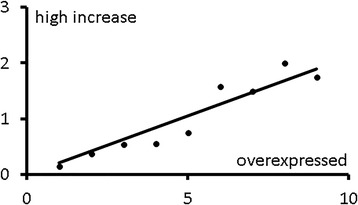
Relation between overexpression mentions in the literature and the subset of those which are high increase. The figure shows the relation between gene overexpression mentions and mean number of high increase mentions for genes with up to nine overexpression mentions. Slope of the zero-y-intercept trend line is 0.21 and its associated r 2 is 0.89