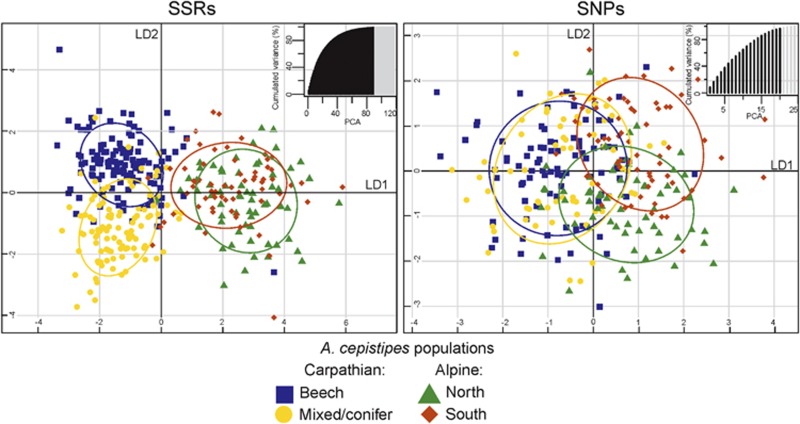
Figure 3.
Discriminant analysis of principle components (DAPC) computed with 17 SSRs and 24 SNPs in four subpopulations of Armillaria cepistipes. Scatterplots represent the distribution of individuals (symbols) along the first two linear discriminants that explain 74% and 15% of the PCs’ variances using SSRs (left) and 71% and 22% using SNPs (right). The cross-validated number of the PCs used for the discriminant analysis is shown in dark color in the bar plots on the top right of each scatterplot.

