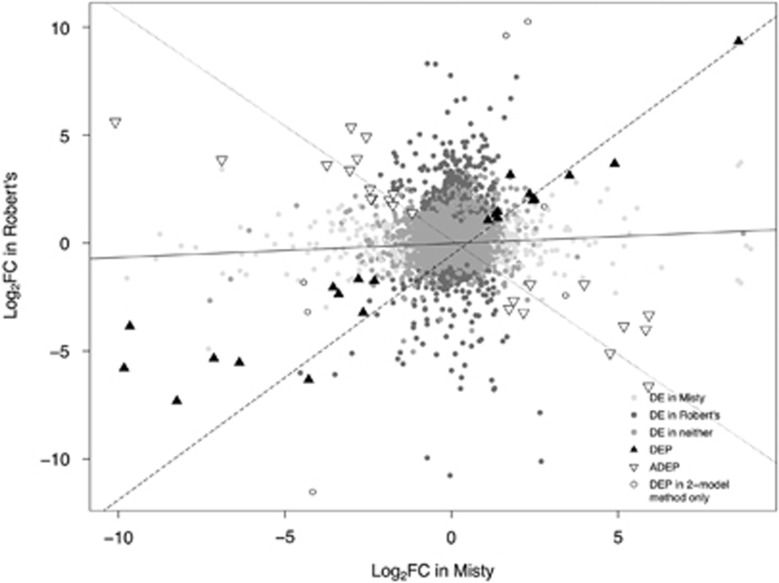
Figure 2.
Scatterplot of log2FC values in Misty versus Robert’s. Colors for differential expression in Misty only, Robert’s only and neither are based on results from the two-model method. Colors for DEP and APDE are based on agreement between both methods. Gray points represent genes that were found to be DEP in the two-model method but not the GLM method. Solid line indicates correlation between all genes, dashed line indicates correlation between DEP genes and dotted line indicates correlation between APDE genes. DE, significantly differentially expressed.

