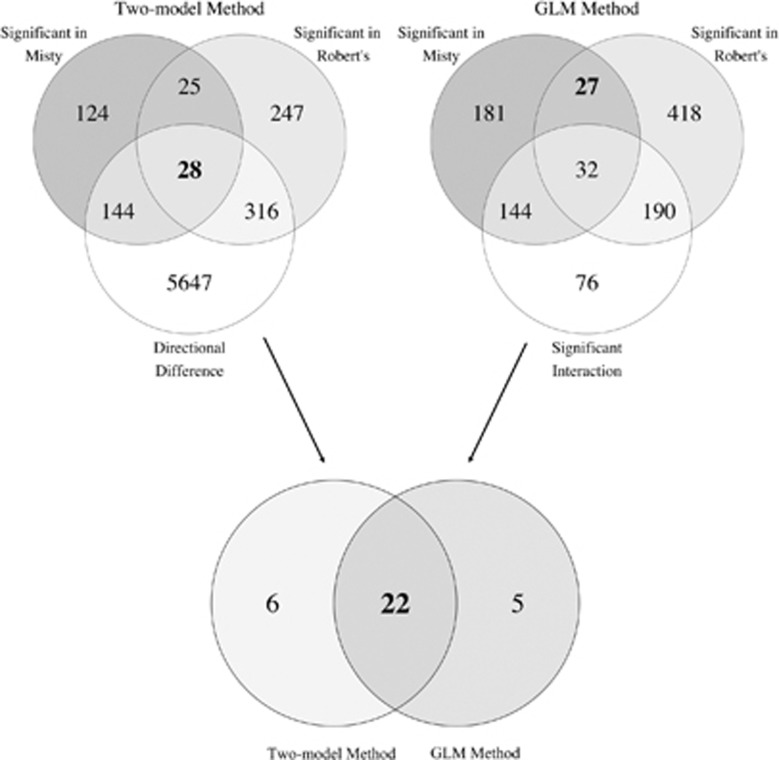
Figure 3.
Venn diagrams showing the number of genes found to be DEP (shown in bold) in both methods. In GLM method, circles show the number of genes significantly differentially expressed in the Misty and Robert’s watersheds, and the number of genes found to have a significant habitat by watershed interaction (thereby indicating nonparallelism). The overlap between the two upper circles therefore represents DEP genes. In the two-model method, circles show the number of genes significantly differentially expressed in the Misty and Robert’s watersheds, and the number of genes with directional expression differences (thereby indicating parallelism). The overlap between all three circles therefore represents DEP genes. Lower diagram shows the DEP gene list overlap between the DEP lists derived from each method as shown in the upper diagrams.

