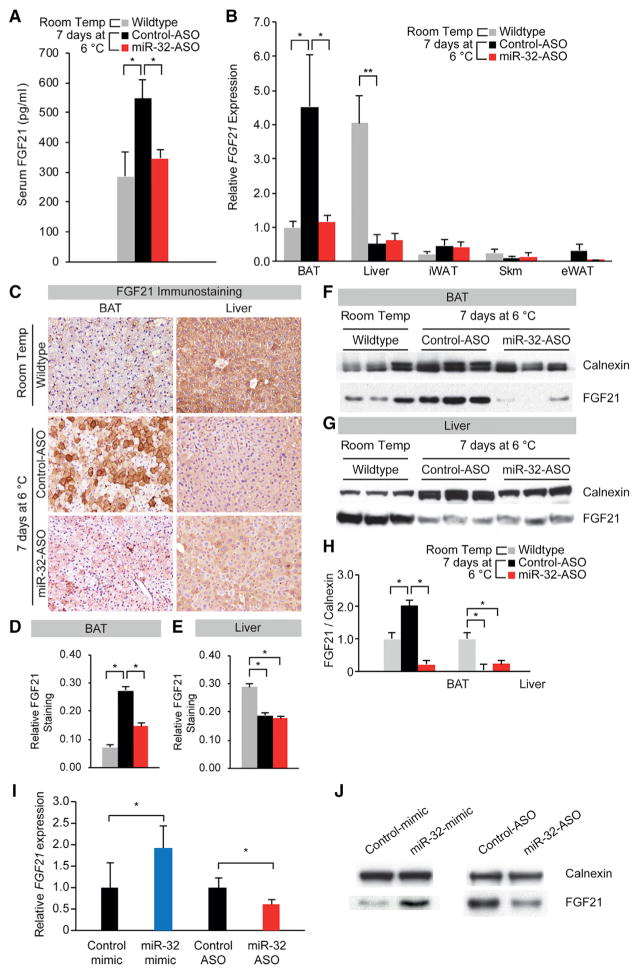
Figure 3. miR-32-ASO-Injected Mice Have Significantly Lower Serum FGF21 Levels due to Failure of FGF21 Upregulation in BAT under Cold Stress.
(A) Cold-induced increase in serum FGF21 levels was blunted by injection of miR-32-ASO as measured by ELISA (n = 7).
(B) qRT-PCR showed that cold stress decreased FGF21 mRNA expression in liver but increased it in BAT. Injection of miR-32-ASO significantly repressed the increase in FGF21 expression in BAT during cold exposure when normalized to PPIA.
(C) FGF21 immunostaining showed that cold stress decreased FGF21 level in liver but increased it in BAT. Injection of miR-32-ASO significantly repressed the increase in FGF21 expression in BAT during cold exposure.
(D) Quantification of FGF21 immunostaining in BAT showed that FGF21 levels within BAT increased greatly after cold exposure but were significantly lower in miR-32-ASO-treated mice compared to control-ASO-treated mice.
(E) Quantification of FGF21 immunostaining in liver showed that FGF21 levels within liver decreased greatly after cold exposure but were similar between miR-32-ASO-treated mice and control-ASO-treated mice.
(F) Western blot showing cold-induced increases in BAT FGF21 protein levels were blunted by injection of miR-32-ASO. Calnexin served as a loading control.
(G) Western blot showing cold-induced decreases in liver FGF21 protein levels were unaffected by injection of miR-32-ASO. Calnexin served as a loading control.
(H) Quantification of the western blot results in (F) and (G) using ImageJ. Average intensities were normalized to that of Calnexin.
(I) FGF21 mRNA expression in WT-1 cells increased or decreased when transfected with miR-32 mimic or miR-32-ASO, respectively.
(J) Western blotting showed that FGF21 protein levels in WT-1 cells increased or decreased when transfected with miR-32 mimic or miR-32-ASO, respectively.
Data represent mean ± SEM. *p < 0.05 and **p < 0.01. See also Figure S3.

