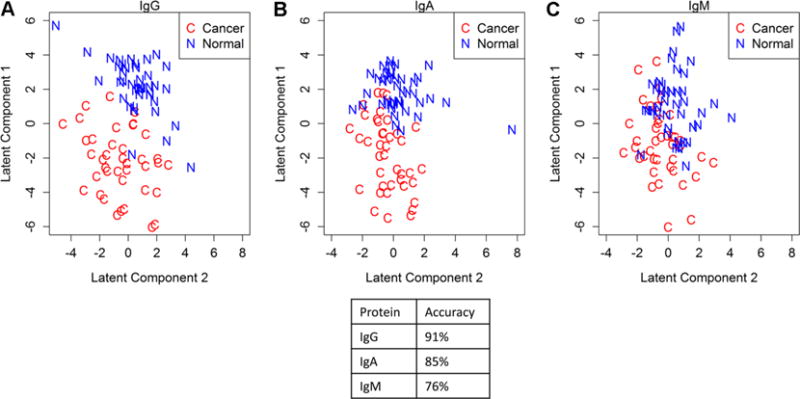
Figure 1.

PLS-LDA analysis of the glycopeptides for the immunoglobulin IgG (A), IgA (B), and IgM (C) in the OC1 discovery set. Clear separation between the EOC cases (n = 40) and the controls (n = 40) is observed for IgG and IgA, while the separation between the disease groups is less for IgM.
