
Figure 2.
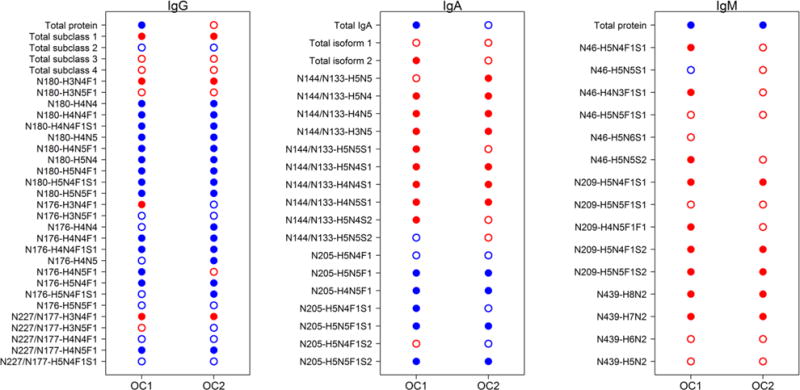
Differential analysis of peptide and glycopeptide variables from immunoglobulins in EOC. Closed dots indicate significantly different abundance levels between EOC cases and healthy controls, while open dots indicate no significance was achieved at the false discovery rate (FDR) < 0.05. Red dots indicate increased levels in EOC cases compared with controls, while blue dots indicate decreased levels in EOC compared with controls.