
Figure 3.
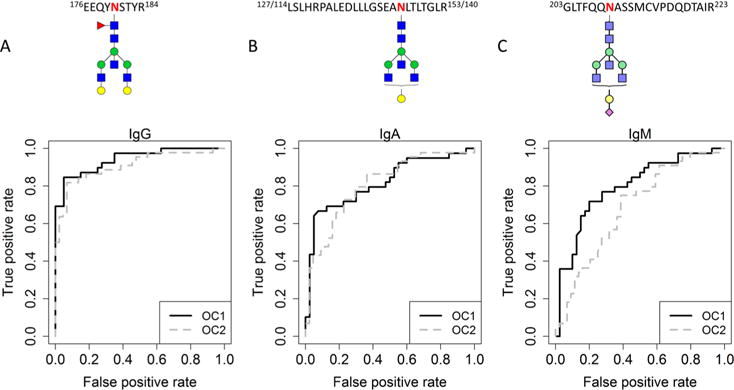
ROC curves for the best performing individual glycopeptides of all three immunoglobulins in the OC1 discovery set and OC2 test set. Curves are shown for IgG1-H5N5F1 (A), IgA N144/131 H4N5 (B), and IgM N209 H4N5F1S1 (C). The ROC curve for the OC1 discovery set is shown in solid black, while the ROC curve for the OC2 test set is shown in dotted gray. Glycan symbol key: blue square is N-acetylglucosamine, green ball is mannose, yellow ball is galactose, red triangle is fucose, and purple diamond is N-acetylneuraminic acid. The glycan structures presented here are putative structures.