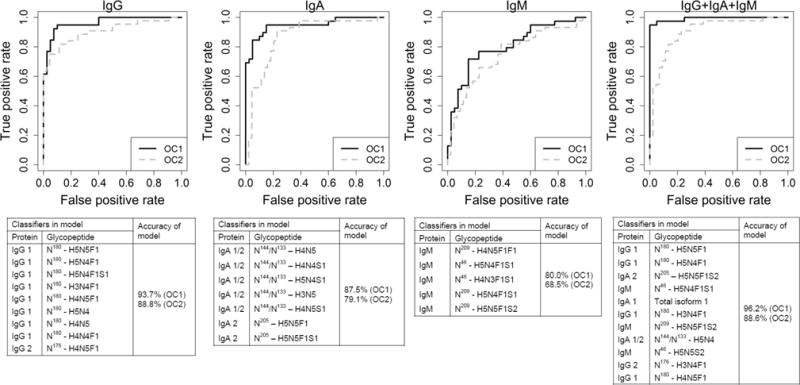
Figure 4.

ROC curves for the four multiclassifier models developed. Curves are shown for IgG, IgA, IgM, and the combined immunoglobulins, respectively. The ROC curve for the OC1 discovery set is shown in solid black, while the ROC curve for the OC2 test set is shown in dotted gray.
