Extended Data Figure 5.
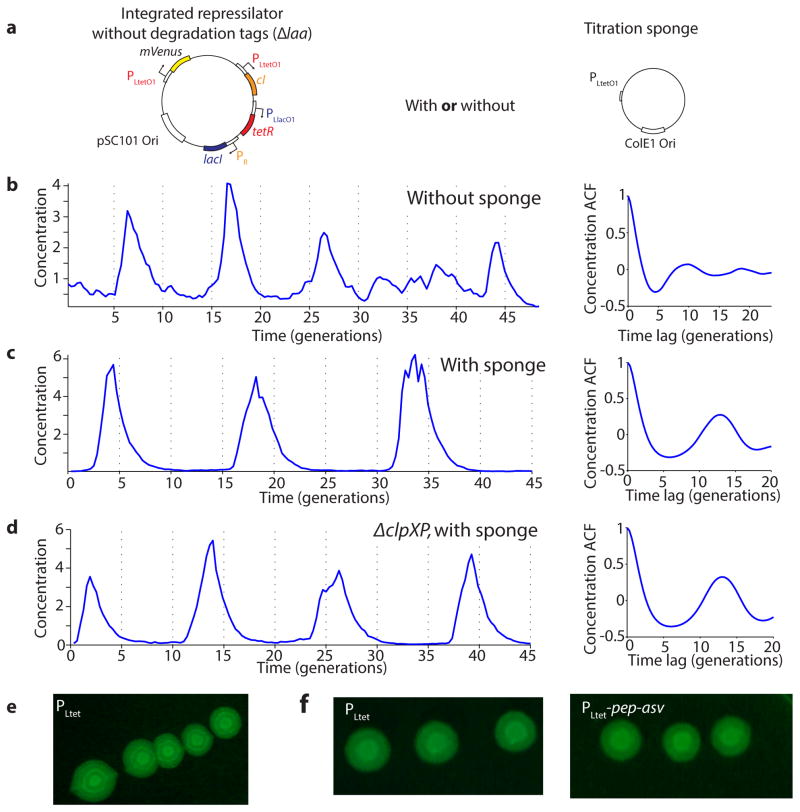
Period histograms and kymographs of selected strains. Peak-to-peak distance of the oscillations was calculated as described in Methods, and the average period, as well as the CV (standard deviation divided by the mean) are reported in the figure panels. a) Original repressilator (NDL332). b) Integrated repressilator (LPT25). c) Integrated repressilator in ΔclpXP (LPT61). d) Integrated repressilator in ΔclpXP with PLtet-mCherry-asv (LPT64). e) Integrated repressilator with PLtet sponge (LPT44). f) Integrated repressilator with PLtet-mCherry-asv (LPT54) g) Kymograph (xy-t montage) of the raw data is presented for three strains. The image of a single growth channel is presented every 1, 2 and 7 frames (5 min/frame) for the top, middle and bottom panel respectively. The oscillations in concentration are difficult to see in the fast oscillator (although clear when looking at production rate), but they can be clearly seen in the slow oscillators. The growth channels are open towards the bottom of the images, where media is supplied.

