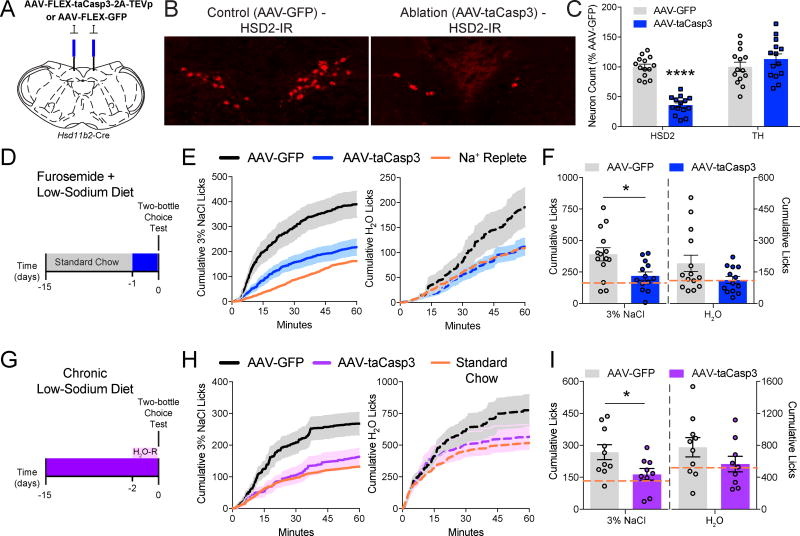
Figure 5. Specific ablation of NTSHSD2 neurons impairs sodium appetite.
Data are presented as mean ± SEM.
A) Schematic of AAV-FLEX-taCasp3-2A-TEVp or AAV-FLEX-GFP injections.
B) Representative HSD2 immunoreactivity (HSD2-IR) in the NTS of AAV-FLEX-GFP (AAV-GFP; left) and AAV-FLEX-taCasp3-2A-TEVp (AAV-taCasp3; right) injected mice.
C) Summary of AAV-taCasp3 ablation efficiency and specificity by counts of NTS HSD2 and tyrosine hydroxylase (TH) positive neurons (n = 13–14 mice/group). Unpaired two-tailed t-test, ****P < 0.0001.
D) Schematic of the experimental protocol used for furosemide-induced Na+ depletion.
E) Time course of 3% NaCl licking (left) or H2O licking (right) following Na+ depletion in AAV-GFP and AAV-taCasp3 injected animals. Orange line depicts the mean intake of Na+-replete animals injected with furosemide and fed standard chow.
F) Summary of 60-minute Na+ appetite test following Na+ depletion in AAV-GFP and AAV-taCasp3 injected animals (n = 13–14 mice/group). Orange line depicts the mean intake of Na+-replete animals injected with furosemide and fed standard chow. Unpaired two-tailed t-test, *P < 0.05.
G) Schematic of the experimental protocol used for chronic dietary Na+ deprivation (H2O-R = H2O-restriction).
H) Time-course of 3% NaCl licking (left) or H2O licking (right) following dietary Na+ deprivation in H2O-restricted animals injected with AAV-GFP or AAV-taCasp3. Orange line depicts the mean intake of Na+-replete animals fed standard chow.
I) Summary of 60-minute Na+ appetite test following dietary Na+ deprivation in H2O-restricted animals injected with AAV-GFP or AAV-taCasp3 (n = 9–10 mice/group). Orange line depicts the mean intake of Na+-replete animals fed standard chow. Unpaired two-tailed t-test, *P < 0.05. Unpaired two-tailed t-test, *P < 0.05.

