. 2017 Aug 31;8(10):7087–7097. doi: 10.1039/c7sc01965c

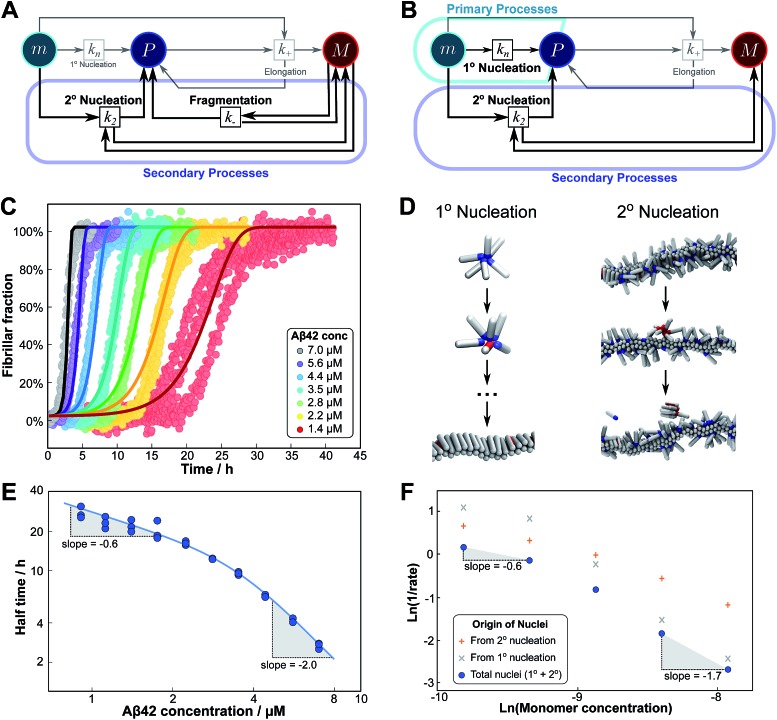
Fig. 6. Parallel processes. Competition of two processes in parallel can be observed between fragmentation and secondary nucleation (left) and in simulations also between primary and secondary nucleation (right). (A) Petri net with both secondary processes active. The relevant region is highlighted. (B) Petri net with primary and secondary nucleation. Although primary nucleation was also present in all other nets presented, it was there assumed to be significant only at very early times. (C) Competition of secondary nucleation and fragmentation appears in the aggregation of Aβ42 at low ionic strengths (4 mM sodium phosphate buffer at pH 8.0, 5 mM NaCl). Points are the relative aggregate mass, measured by ThT fluorescence, solid lines are the global best fit using 4 free fitting parameters. Some curves at low monomer concentrations are omitted for clarity although all the data were used to obtain the fit. (D) A minimal model of secondary nucleation was used in a Monte-Carlo algorithm where proteins were modeled as rods with attractive patches; a visualization of the primary and secondary nucleation processes is shown.17,23 (E) Half time versus initial monomer concentration. The solid line is plotted using the parameters obtained through the fit in (C). Note the negative curvature due to an increase in the monomer dependence when secondary nucleation dominates over fragmentation at high monomer concentrations. (F) The overall rate of nucleus formation (blue circles), the rate of nucleus formation from primary nucleation (grey crosses) and from secondary nucleation (red pluses) as obtained from the Monte-Carlo simulations (D). The negative curvature agrees with the predicted behaviour and moreover the simulations allow one to directly establish the origin of the nuclei, again confirming the prediction that the more monomer-dependent process dominates at high monomer concentrations.

Fig. 6