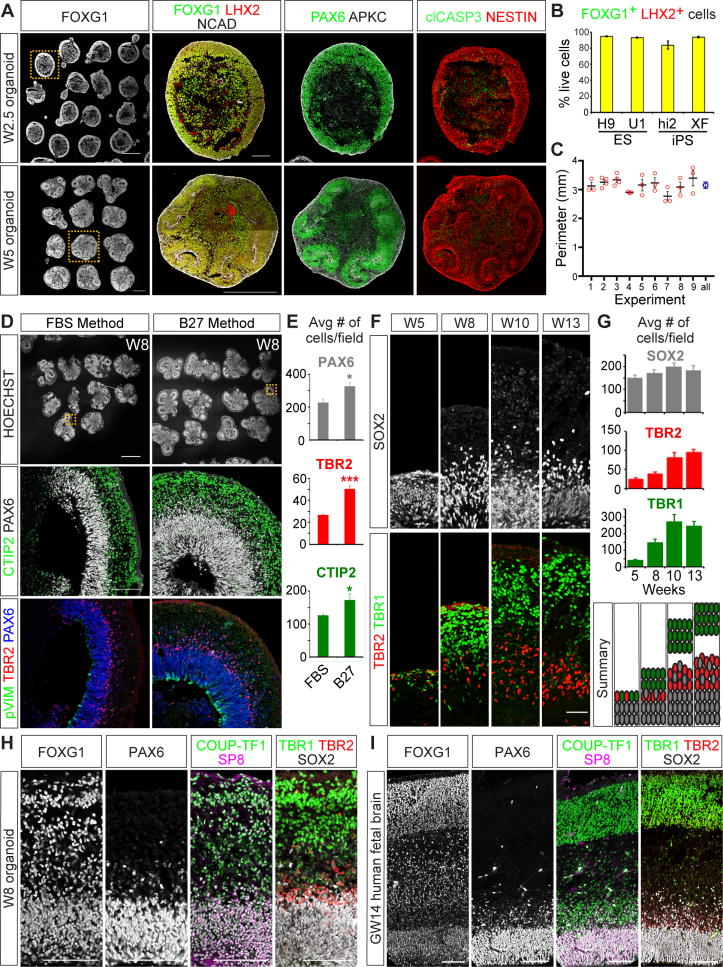
Figure 1. Establishment of highly reproducible cortical organoid methods that recapitulate human development in vivo.
(A) Cerebral organoids immunostained for telencephalic (FOXG1/LHX2/PAX6), apical membrane (NCAD/APKC), progenitor (NESTIN), and cell death (clCASP3) markers. (B) Percentage of FOXG1+ and LHX2+ cells out of total live cells per organoid. hESC lines, H9 and UCLA1 (U1), and hIPSC lines, HiPS2 (Hi2) and XFiPS (XF). H9 n = 9, n = 3 for other lines. Data are represented as mean ± SEM. (C) The perimeters of W2.5 organoids derived from H9 across nine experiments plotted as mean ± SEM. All (blue circle) indicates the summation of all samples plotted as mean and 95% confidence intervals. No significance between samples by one-way ANOVA. (D-E) Comparison of FBS versus B27 media components, showing CTIP2+ neurons, TBR2+ intermediate progenitor, PAX6+ progenitor, and pVIM+ dividing RG cell markers n=3. Data are represented as mean ± SEM. (F) Laminar growth of cerebral organoids showing SOX2+ progenitor, TBR2+ intermediate progenitor, and TBR1+ neurons. (G) Average number of cells per field ± SEM at various time points. n=3. (H-I) Comparative immunohistochemical analyses of W8 cerebral organoids (H) and GW14 human fetal cortex (I). Scale bars: A FOXG1 and W5 FOXG1/LHX2/NCAD 500 μm; A W2.5 FOXG1/LHX2/NCAD, D, H, I, 100 μm; D HOESCHT, 1mm; F, 50 μm. See also Figures S1, S2, and S3.

