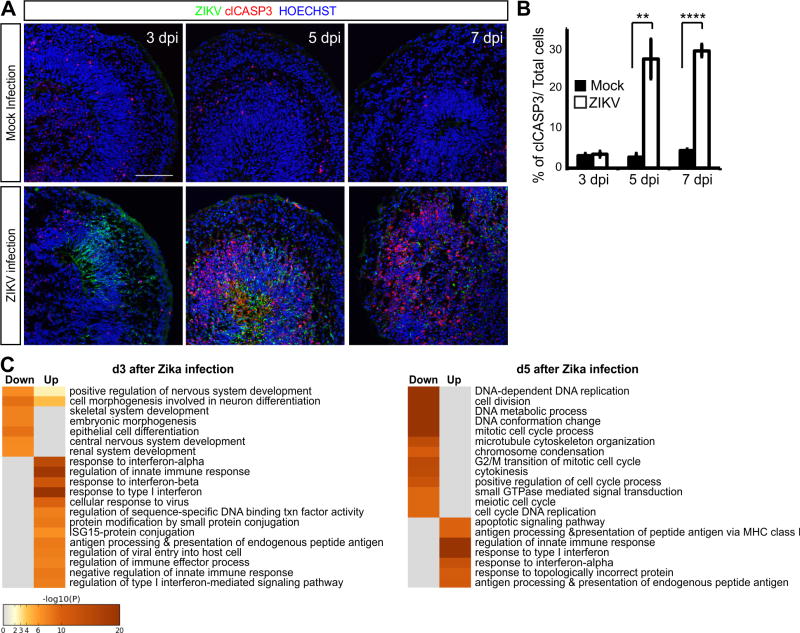
Figure 6. Immune response and programmed cell death in cerebral organoids infected with ZIKV.
(A) Immunostaining of W8 organoids infected with ZIKV for the indicated number of days. Scale bar: 100 μm. (B) Percentage of cells per field positive for clCASP3 out of total cells. n=3. Data are represented as mean ± SEM. (C) Gene ontology (GO) annotation of the upregulated and downregulated transcripts in W8 organoids after 3 and 5 dpi with ZIKV compared to mock infected organoids by RNA sequencing. See also the lists of the top 50 upregulated (Table S2) and downregulated genes (Table S3). Cell color represents the –log10 (p-value) for overrepresentation of each GO category within up or downregulated genes. See also Figure S8.

