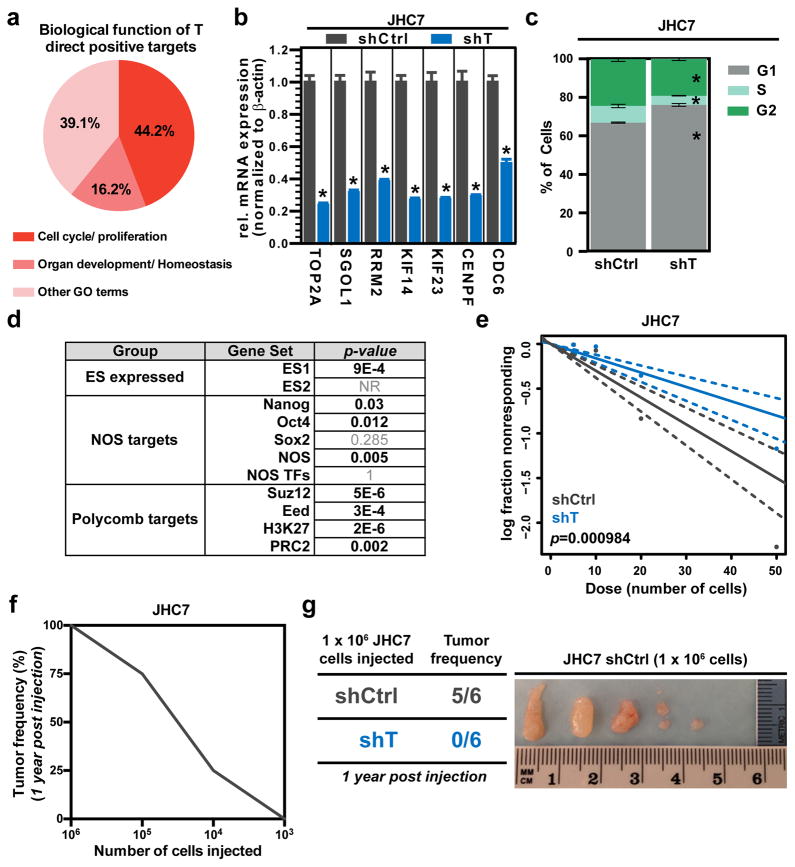
Figure 1. Brachyury regulates cancer stemness and tumor-initiating capacity in chordoma.
a, Distribution of biological functions associated to brachyury (T) direct positive targets, identified by GO terms. b, mRNA expression of cell cycle regulator genes in shCtrl or shT JHC7 cells. c, Average percentage of cells in each cell cycle phase in shCtrl or shT JHC7 cells. d, Gene set enrichment analysis (GSEA) of T signature for signatures specific for embryonic stem cells (ES expressed), Nanog, Oct4, and Sox2 (NOS) targets, and polycomb targets. e, Representative in vitro extreme limiting dilution assay plating decreasing numbers of shCtrl or shT JHC7 cells. Solid lines: mean; dotted lines: 95% confidence interval; circles: values obtained in each cell dilution. f, In vivo limiting dilution assay showing relationship between number of JHC7 cells injected subcutaneously in mice and tumor formation capacity after a year (as assessed by tumor frequency in %). g, Left: Table showing tumor frequency in mice injected subcutaneously with the 1×10⁶ shCtrl or shT JHC7 cells after 1 year. Right: Images of isolated JHC7 tumor mass from mice injected subcutaneously with 1×10⁶ shCtrl cells after 1 year. All error bars are s.e.m. * = P<0.05. See also Figures S1, S2, and S3.

