Figures 1a and 1b.
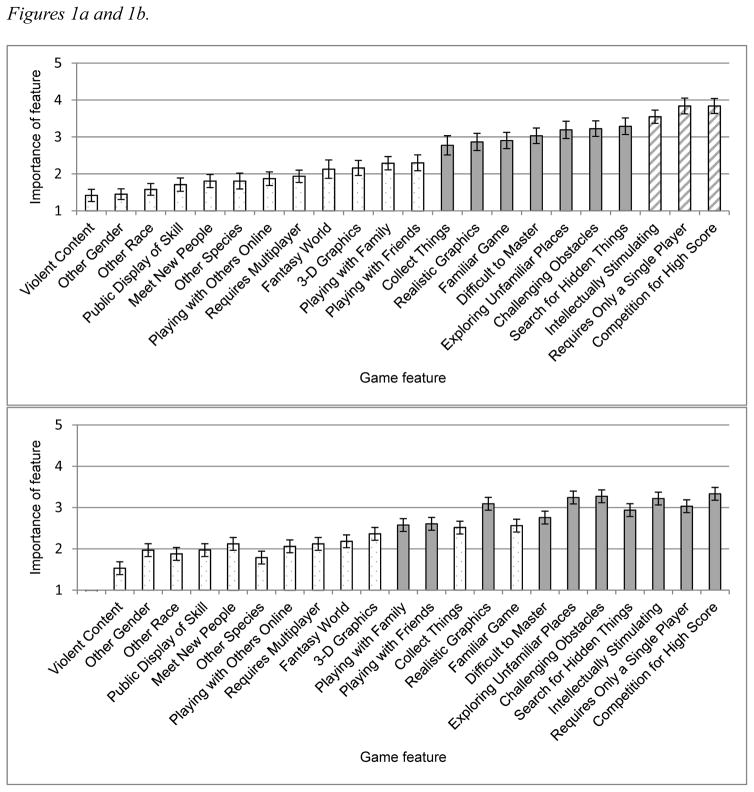
The perceived importance, on a scale of 1–5, of various video game features for older adults. The top figure displays the perceived importance of a selection of 22 video game features for older adult gamers, and the bottom figure displays the perceived importance of these same features for older adult non-gamers. Features that were preferred (p < .05) are represented by the white bars with diagonal lines while games that were not preferred (p < .05) are represented with the white bars with dots. Neutral games (p > .05) are represented in gray. A one-sample t-test against the neutral value (3) was used to assess significance. The error bars represent standard error.

