
Figure 6.
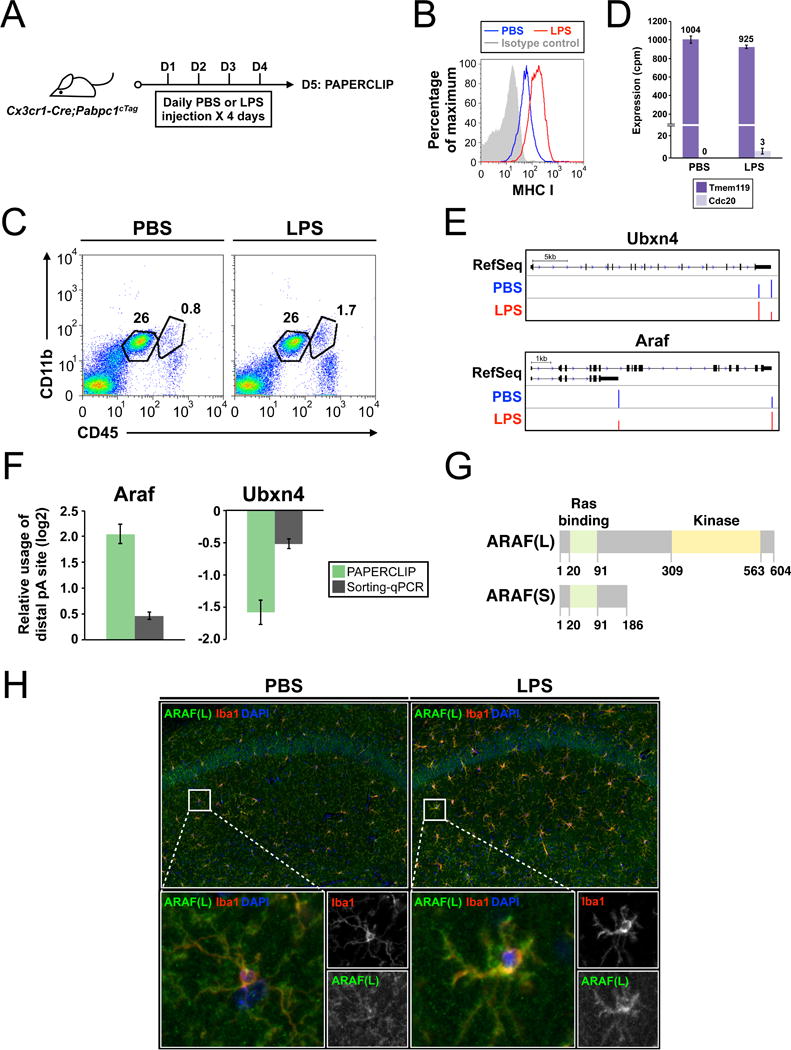
cTag-PAPERCLIP reveals that activated microglia upregulates full-length ARAF through APA switch. (A) A schema showing the experimental design to identify APA events at microglia activation by cTag-PAPERCLIP. (B) Flow cytometry results showing a full activation of brain microglia by the LPS injection protocol. (C) Representative flow cytometry results from PBS- or LPS-treated Cx3cr1-Cre; Pabpc1cTag mouse brain showing that the LPS injection protocol does not result in heavy infiltration of blood monocytic cells [the (Cd11b+, Cd45high) population on the right]. The (Cd11b+, Cd45intermediate) population on the left is microglia. (D) Bar graphs showing the cell-type-specific marker expression in cTag-PAPERCLIP data from PBS- or LPS-injected Cx3cr1-Cre; Pabpc1cTag mice. Tmem119, a microglia-specific marker. Cdc20, a monocyte-specific marker. Error bars: standard error. cpm: counts per million. (E) Diagrams showing switches in the major poly(A) sites at the Ubxn4 and Araf loci (top row, ‘RefSeq’) in activated microglia as identified by cTag-PAPERCLIP, shown as the sum of the three biological replciates (middle and bottom rows; ‘PBS’ and ‘LPS’). Y-axis: normalized read depth (scaled in each individual track). (F) Bar graphs showing the relative usage of the distal poly(A) site (LPS/PBS) at the Ubxn4 and Araf loci as determined by cTag-PAPERCLIP in Cx3cr1-Cre; Pabpc1cTag mice or qRT-PCR on sorted microglia from wildtype B6 mice. Error bars: standard error. (G) Schematics showing the lengths and the annotated domains in ARAF proteins generated by the two Araf APA isoforms. Numbers denote amino acid residues. (H) Immunofluoresence microscopy of PBS-treated (left) or LPS-treated (right) wildtype B6 mouse brain demonstrates an increase in full-length Araf protein [ARAF(L)] expression in activated microglia. Images from the two groups were taken under the same conditions. The results were reproduced in an independent experiment and representative images are shown. Iba1: a microglia marker.