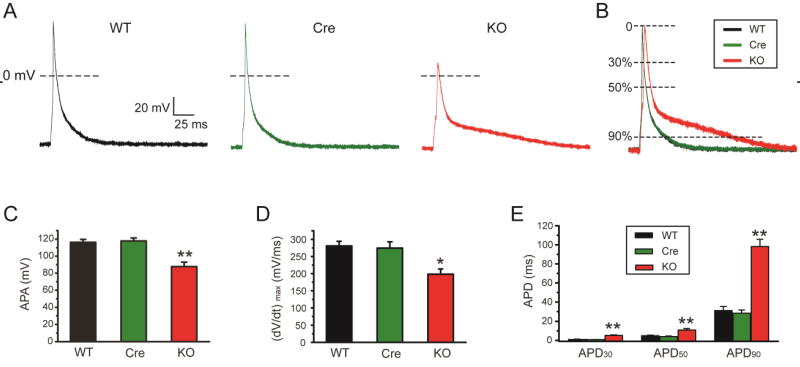
Fig. 2.
Action potentials were altered in FGF13 cardiac-specific knockout mice. (A) Representative action potential traces recorded in WT, Myh6-MCM (Cre) and Fgf13 KO (KO) mice. (B) Normalized and superimposed representative action potential traces from A, (C–E) Action potential peak amplitude (APA) (C), maximal velocity of phase 0 (dV/dtmax) (D), and action potential duration (APD) at 30, 50, and 90% repolarization (E) in WT, Cre, and Fgf13 KO mice. *indicates p<0.05 **indicates p<0.01 versus WT, n=8, 8, and 14 cells for WT, Cre and KO mice, respectively (N=3 mice per group).

