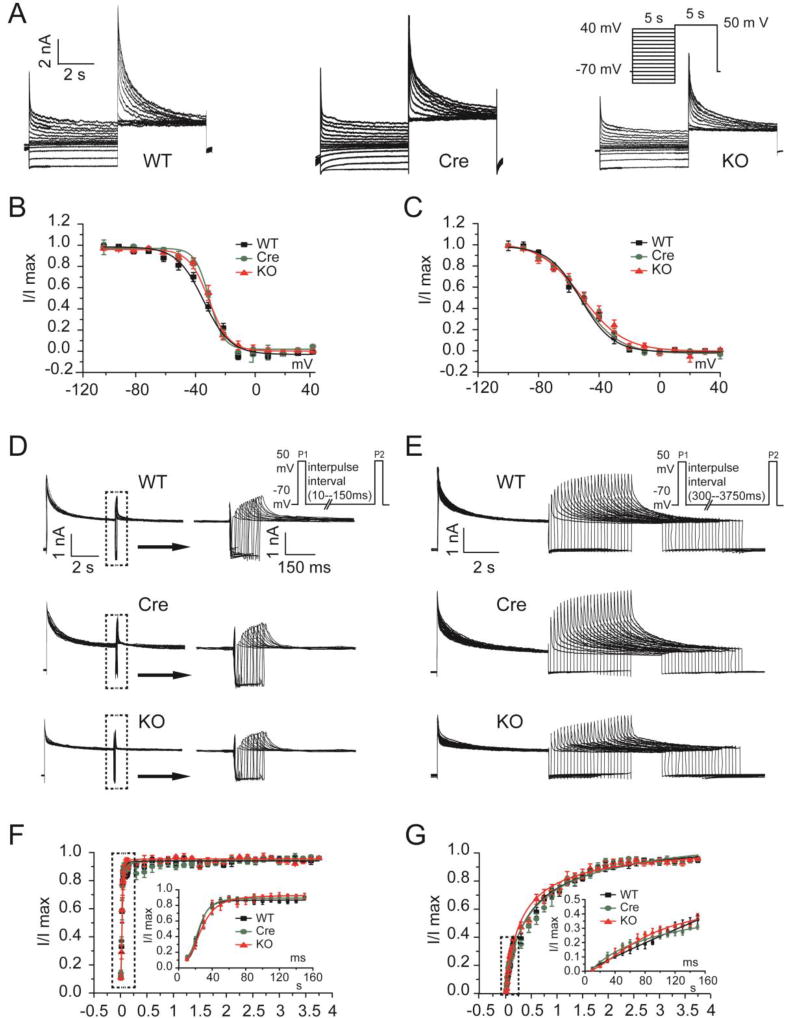
Fig. 6.
Inactivation and recovery from inactivation of outward K+ currents were not modified in FGF13 KO mice. (A) Exemplar inactivation of Ito current traces elicited by 5-s conditioning pulses from a holding potential of −70 mV to voltages between −100 mV and +40 mV in 10-mV increments prior to a test potential at +50 mV (inset). Inset shows schematic of the voltage clamp protocol. (B) Summarized Ito, fast inactivation curves for WT, Myh6-MCM (Cre) and Fgf13 KO (KO) mice. (C) Summarized Ik, slow inactivation curves for WT, Cre, and KO mice (n=8, 9, and 10 for WT, Cre, and KO, N=3 mice per group). (D and E) Exemplar recovery from inactivation of Ito current traces determined from a holding potential of −70 mV, using 30-ms pulses separated by a recovery time from 10 to 150 ms at +50 mV (D) or from 300 to 3750 ms at +50 mV (E). Inset shows schematic of the voltage clamp protocol. (F) Normalized Ito, fast recovery vs interpulse interval for WT, Cre, and KO mice. (G) Normalized Ik, slow recovery vs interpulse interval for WT, Cre, and KO mice (n=7, 7, and 6 for WT, Cre, and KO, N=3 mice per group).

