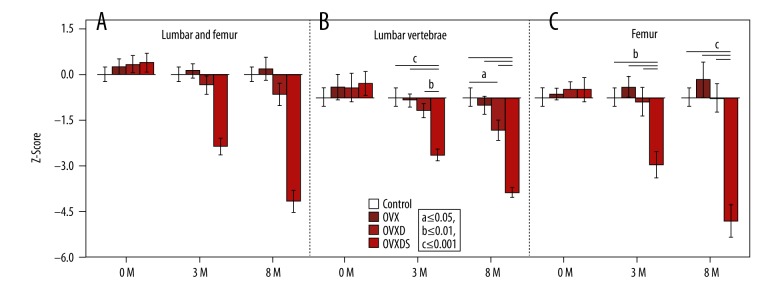
Figure 3.
Z-score is affected by the region of analysis reflecting general bone status. (A) Z-score of all ROIs has an intermediate pattern between the regions but still significantly lower in the triple treatment group. (B) Lower but not significant Z-scores in the OVXD at 3 months and 8 months in LV. (C) An intriguing not significant increase in Z-score of OVX in the femur at 3 months and 8 months (Bonferroni-corrected Mann-Whitney U test. P≤0.05; a≤0.05, b≤0.01, and c≤0.001).

