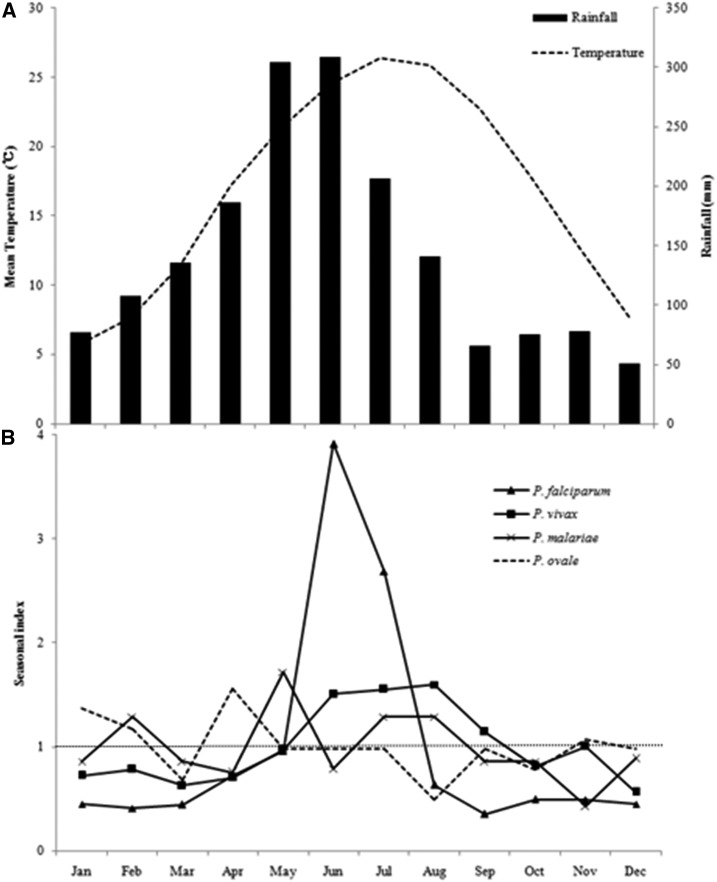
Figure 2.
Seasonal distribution of malaria in Guangxi, 2004–2015. (A) Meteorological parameters comprising rainfall (black column) and temperature (black dash line) were indicated and (B) Seasonal index of Plasmodium falciparum (triangle), Plasmodium vivax (square), Plasmodium malariae (cross), and Plasmodium ovale (dash line). Seasonal index equal to 1 was indicated in the figure. The environmental data are mean values from 2004 to 2015.

