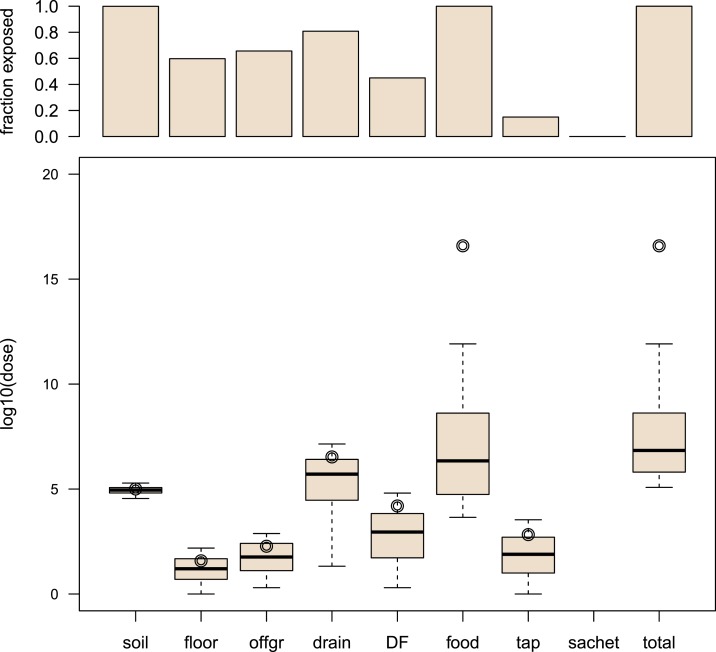
Figure 3.
Exposure to fecal contamination from different sources for children of 2–5 years in Bukom. Top graph: bar chart of the fraction exposed (i.e., percent of child days exposed to any number of Escherichia coli among 10,000 simulated days). Bottom graph: boxplots of log10 dose of E. coli (unit of dose is CFU/day). Note that the “whiskers” show 5th and 95th percentiles instead of adjacent values. The upper/lower adjacent value is the value of the largest/smallest observation that is less/greater than or equal to the upper/lower quartile plus/minus 1.5 the length of the interquartile range. No outliers are shown in the boxplots, and the circle represents the log10 of the arithmetic mean of nonzero doses. offgr = “off-ground surfaces,” DF = “direct contact with own feces,” tap = “tap water,” sachet = “sachet water.” This figure appears in color at www.ajtmh.org.

