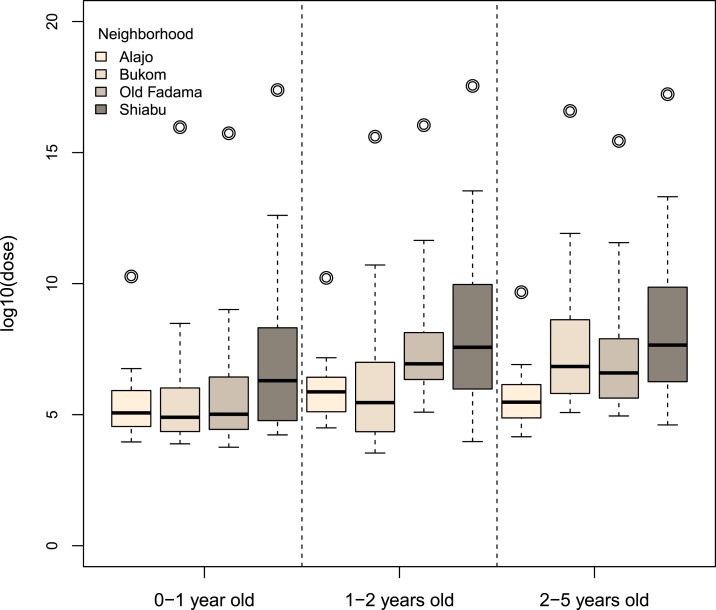
Figure 4.
Total exposure to fecal contamination by neighborhood and age group. Boxplots of log10 dose of Escherichia coli (unit of dose is CFU/day). Note that the “whiskers” show 5th and 95th percentiles. No outliers are shown in the boxplots, and the circle represents the log10 of the arithmetic mean of nonzero doses. This figure appears in color at www.ajtmh.org.

