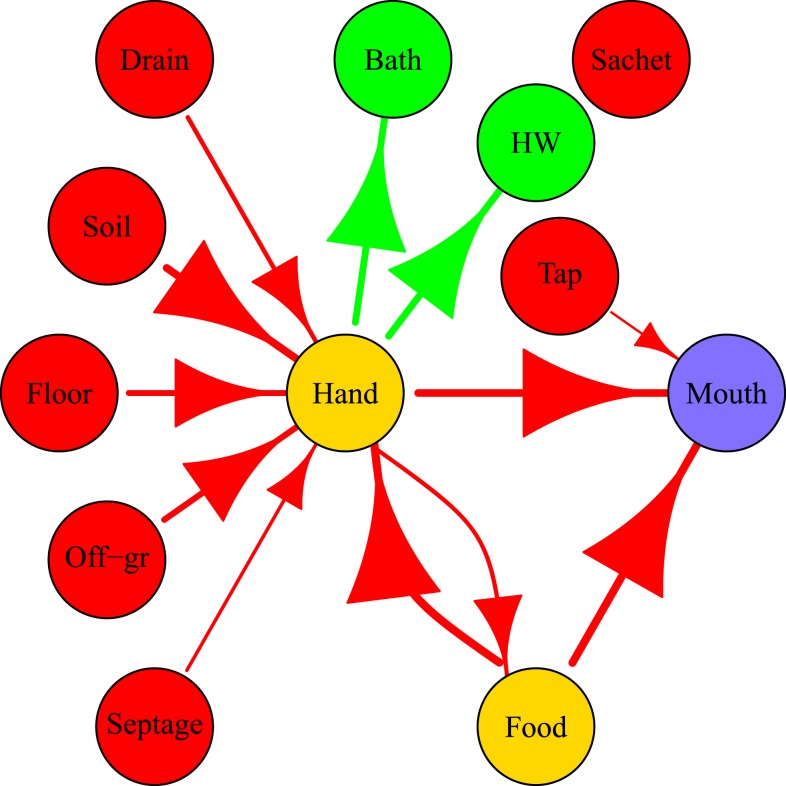
Figure 6.
Fecal microbes transfer networks averaged over 10,000 simulated child days for children of age 2–5 years in Bukom. DF = “direct contact with own feces,” HW = “handwashing,” tap = “tap water,” sachet = “sachet water.” The size of arrows and edges are proportional to the log10 of the average numbers of fecal microbes transferred (for 10,000 simulated child days). The color of nodes represents their role in the network. Red: sources; yellow: vehicles (can be source and sink); green: sinks (remove contamination); purple: ingestion.

