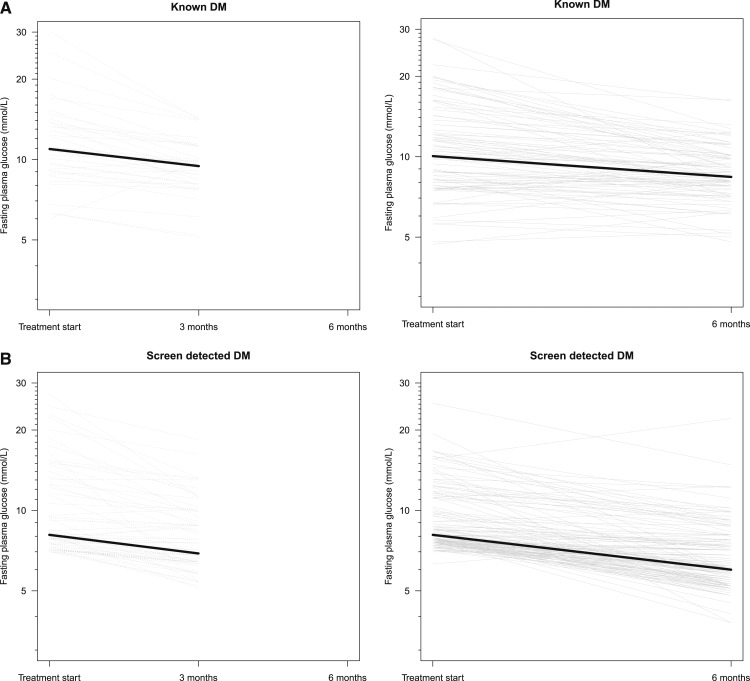
Figure 1.
(A) Longitudinal course of fasting plasma glucose levels for tuberculosis (TB) patients. Fasting plasma glucose levels for both screen-detected diabetes (SDM) and known diabetes (KDM) at start of TB treatment and after 3 or 6 months are illustrated. The median of fasting plasma glucose is highlighted for each group: for the SDM group, the median decrease (IQR 25;75) was 1.2 mmol/L (0.5;3.1) and 2.1 mmol/L (1.2;3.0) after 3 and 6 months, respectively. For persons with KDM, the median decrease was 1.5 mmol/L (1.0;3.6) and 1.7 mmol/L (0.6;3.5) after 3 and 6 months, respectively. (B) Longitudinal course of fasting plasma glucose levels for tuberculosis (TB) patients. Fasting plasma glucose levels for both screen-detected diabetes (SDM) and known diabetes (KDM) at start of TB treatment and after 3 or 6 months are illustrated. The median of fasting plasma glucose is highlighted for each group: for the SDM group, the median decrease (IQR 25;75) was 1.2 mmol/L (0.5;3.1) and 2.1 mmol/L (1.2;3.0) after 3 and 6 months, respectively. For persons with KDM, the median decrease was 1.5 mmol/L (1.0;3.6) and 1.7 mmol/L (0.6;3.5)after 3 and 6 months, respectively.

