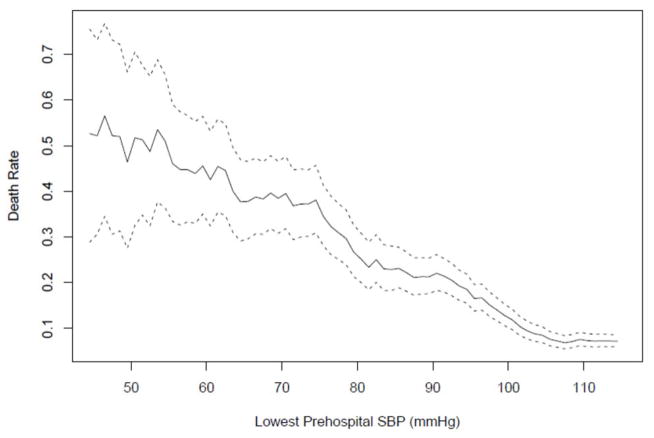
Figure 1. Unadjusted Moving Average of Death Rate by Lowest SBP.
The solid curve represents the moving average of the estimated death rate for each interval spanning 10 consecutive values and the broken curves represent the pointwise 95% confidence bands. The details of these calculations are given in the Statistical Analysis section.

