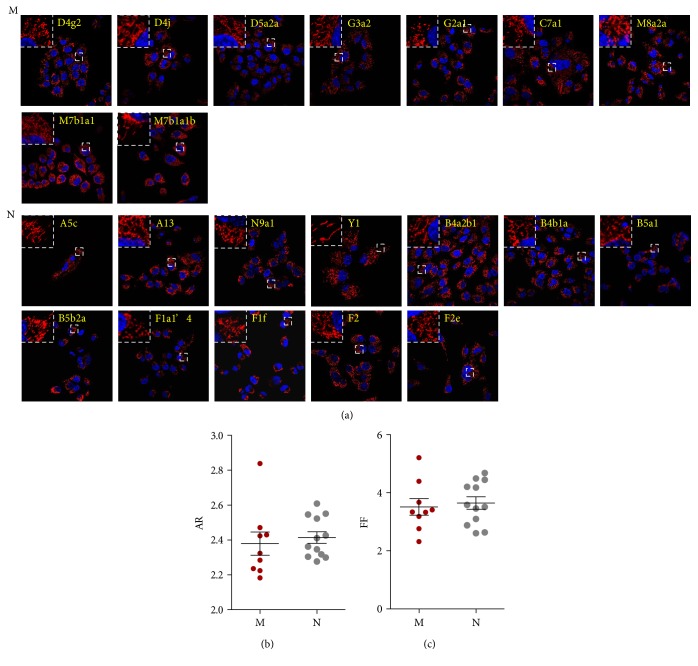
Figure 8.
Morphometric analysis of mitochondria in cybrid cells. (a) Confocal micrographs of 21 cybrid cells in which the mitochondria were stained with MitoTracker Red (n = 3. Images are shown at 600x magnification. The upper and lower two rows show cybrid cells with macrohaplogroups M and N, respectively. mtDNA haplogroups are shown in yellow color. (b, c) Mitochondrial fragmentation was determined by AR (b) and FF (c), with higher values representing increased mitochondrial length/width and branching, respectively.

