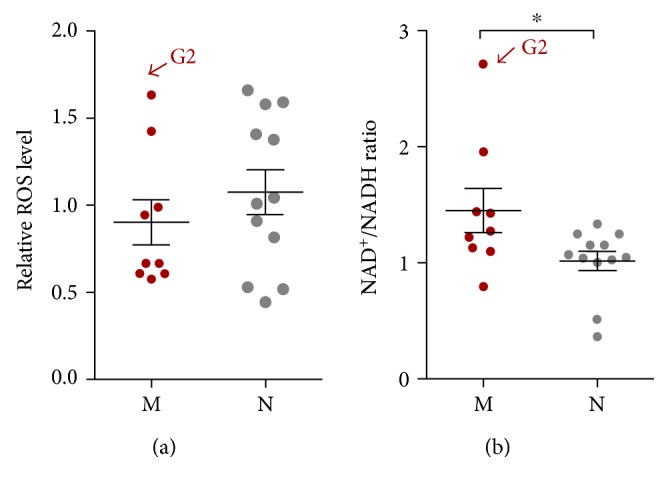
Figure 9.

Measurement of intracellular mitochondrial signals in cybrid cell lines. (a) Comparison of intracellular ROS levels in cybrid cells. ROS levels were determined by staining cells with dichlorofluorescin diacetate. (b) NAD+/NADH ratio was higher in cybrid cells with haplogroup M than in those with haplogroup N. NAD+ and NADH levels in cell extracts were quantified based on fluorescence. Relative ROS levels were calculated by comparing reads obtained from the plate reader to the average value for all 21 cybrids. Data represent mean ± SEM of three independent experiments with 3 replicates each per cybrid. ∗P < 0.05.
