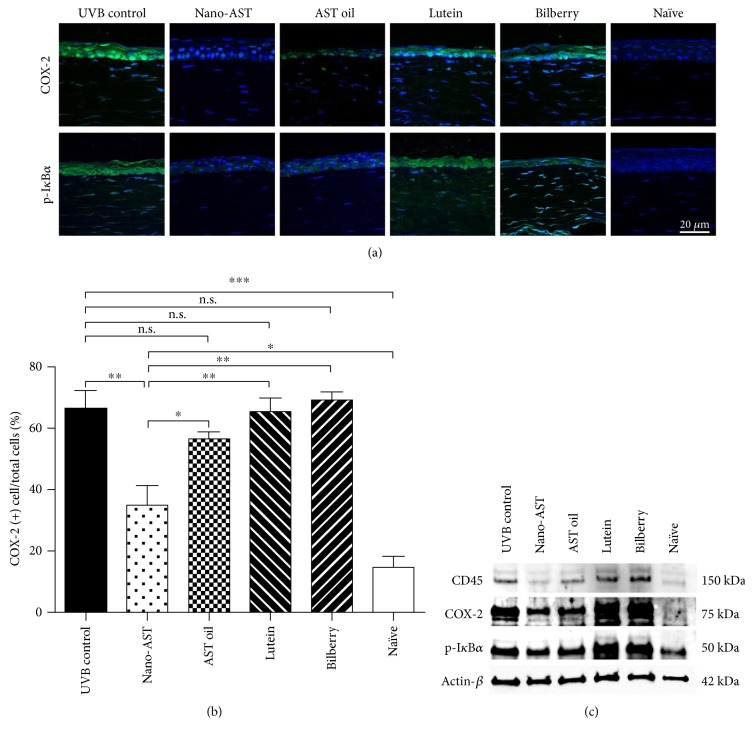
Figure 6.
Expression level of COX-2, phospo-IκBα (p-IκBα), and CD45 in corneal tissue. (a) COX-2 (green) and phospho-IκBα (green) expression in corneal tissue of treated (nano-AST, AST oil, lutein, and bilberry) and control mice (UVB control, naïve); nuclei counterstained by DAPI (blue). Scale bar = 20 μm. (b) Quantitative results for COX-2 expression were calculated by a number of COX-2-positive cells per section relative to the total number of cells counted by DAPI signal and averaged. Numbers of COX-2-positive cells were significantly reduced in the nano-AST-challenged group (p < 0.01), but AST oil-, lutein-, and bilberry extract-treated animals revealed similar amount of COX-2-positive cells as the UVB control group (p > 0.05). n = 5 (eyes) per group. (c) CD45, COX-2, and phospho-IκB-α expression were further confirmed by Western blot analysis. β-Actin was used as loading control. n.s., p > 0.05; ∗p < 0.05; ∗∗p < 0.01; ∗∗∗p < 0.001.

