
Figure 7.
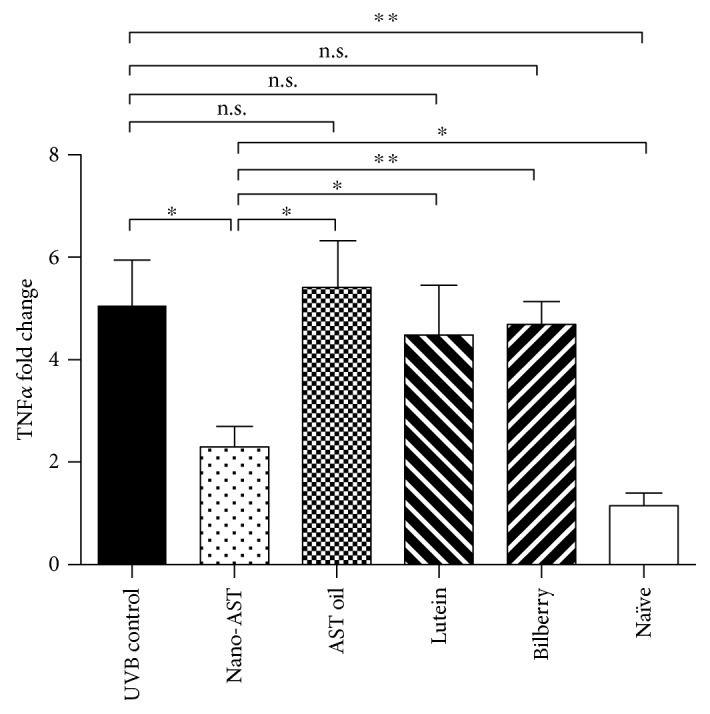
Quantitative PCR analysis of TNFα expression in the mouse cornea. Significant reduction in fold change TNFα expression when compared to the UVB control in nano-AST- (p < 0.05) treated group. AST oil, lutein, and bilberry extract were not significantly different from the UVB control group (p < 0.05). N = 5 (animals per group). Data represented as fold change relative to the naïve control group. n.s., p > 0.05; ∗p < 0.05; ∗∗p < 0.01.