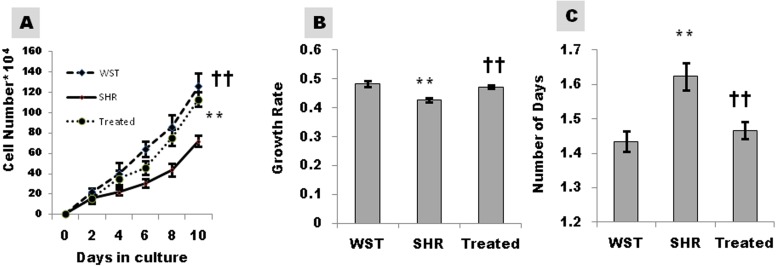
Figure 3. Effect of famotidine on growth kinetics, growth rate and population doubling time of atrial CSCs.
(A) Growth kinetics of CSCs represented as cell number*104 (B) Growth rate calculated as LogN of the ratio of cell number at two fixed time points (C) Population doubling time (PDT) represented as number of days. Data presented as mean ± SD. Variation was analyzed by ANOVA followed by Student t-test. (∗∗p < 0.01 SHR Vs WST; ††p < 0.01 & †p < 0.05 SHR vs. Famotidine) ANOVA p < 0.01 (n = 6/group).

