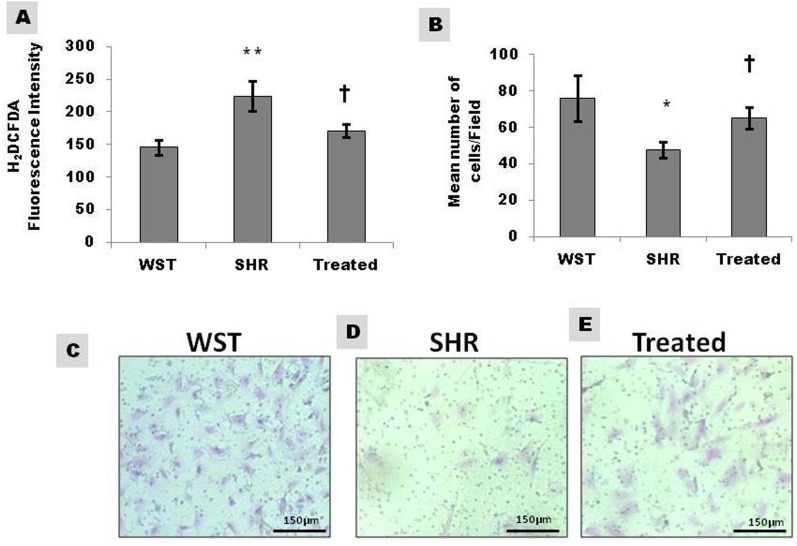
Figure 4. Effect of famotidine on intracellular reactive oxygen species (ROS) and migration potential of atrial CSCs.
(A) ROS levels in CSCs represented as H2DCFDA fluorescence intensity (B) Graphical representation and (C–E) Representative images of the migrated cells. Extent of migration is represented as mean number of cells/field. Data presented as mean ± SD. Variation was analysed by ANOVA followed by Student t-test. (∗∗p < 0.01 & ∗p < 0.05 SHR Vs WST; †p < 0.05 SHR vs. Famotidine) ANOVA p < 0.01 (n = 6/group).

