Figure 3.

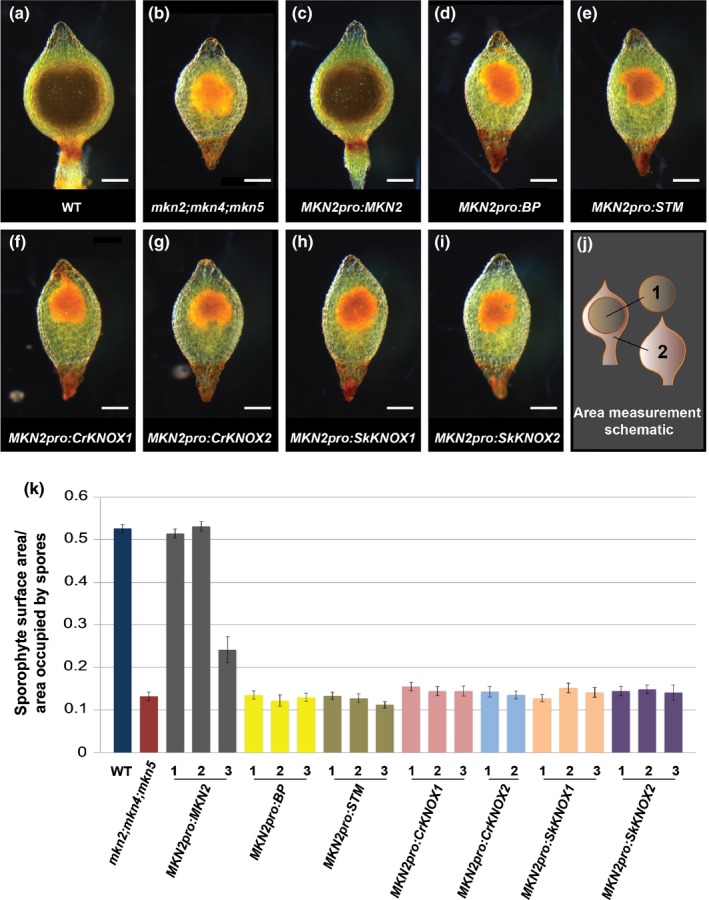
Cross‐species complementation tests with Physcomitrella patens mkn triple mutants. (a–i) Representative sporophyte phenotype of (a) wild‐type (WT), (b) mkn2;mkn4;mkn5 mutant, and (c–i) mkn2;mkn4;mkn5 mutants transformed with (c) MKN2pro:MKN2, (d) MKN2pro:BP, (e) MKN2pro:STM, (f) MKN2pro:CrKNOX1, (g) MKN2pro:CrKNOX2, (h) MKN2pro:SkKNOX1 and (i) MKN2pro:SkKNOX2 constructs. Bars, 200 μm. (j, k) Schematic depiction of measurements taken (j) and average ratios of sporophyte surface area to the area occupied by spores (k) for the lines exemplified in (a–i). Thirty sporophytes from each of three independent transformed lines were analysed for each construct, with the exception of MKN2pro:CrKNOX2 for which only two independent lines were recovered. Error bars represent ± SEM.
