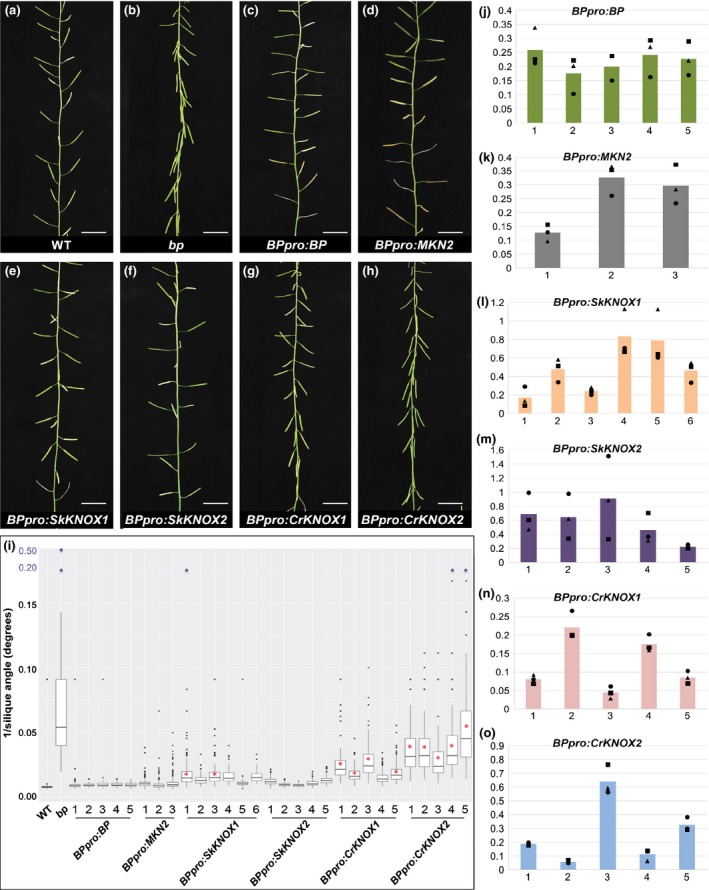
Figure 4.

Cross‐species complementation tests with Arabidopsis bp‐9 mutants. (a–h) Representative inflorescence phenotype of (a) wild‐type (WT), (b) bp‐9 mutant, and (c–h) homozygous bp‐9 mutant plants transformed with (c) BPpro:BP, (d) BPpro:MKN2, (e) BPpro:SkKNOX1, (f) BPproSkKNOX2, (g) BPpro:CrKNOX1 and (h) BPpro:CrKNOX2 constructs. Bars, 2 cm. (i) Boxplot showing range of silique angles on the primary inflorescence of lines exemplified in (a–h). Primary inflorescences from 10 plants of at least three independent lines per transgene were analysed. Red asterisks indicate lines that are significantly different (P < 0.05) from WT. All lines are significantly different (P < 0.05) from bp‐9 mutants. Note that blue points on the y‐axis are not to scale relative to those in black. (j–o) Quantitative reverse transcription polymerase chain reaction (qRT‐PCR) analyses of (j) BPpro:BP, (k) BPpro:MKN2, (l) BPpro:SkKNOX1, (m)BPpro:SkKNOX2, (n) BPpro:CrKNOX1 and (o) BPpro:CrKNOX2 transgene expression. Numbers on the x‐axis represent independent transgenic lines as indicated in (i). The y‐axis represents transcript levels (N 0) normalized against the EF1Balpha2 and UBP6 genes. Three technical replicates were performed for three different biological samples of each independent line. Scatter blots represent values of individual biological replicates; bars represent mean of three biological replicates.
