
Figure 5.
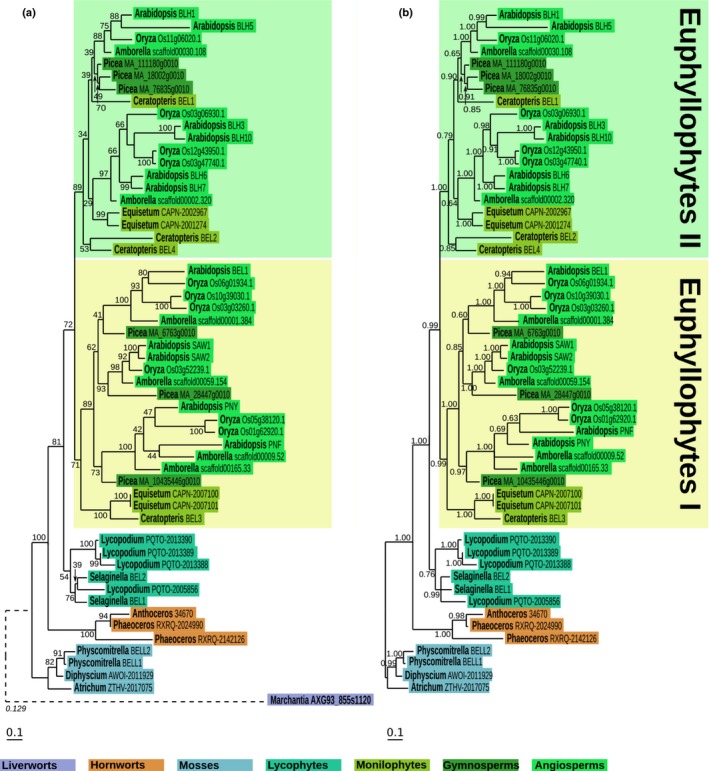
Maximum‐likelihood and Bayesian phylogenetic analysis of BELL homologues. (a, b) Phylogenetic trees inferred with (a) RA x ML or (b) MrBayes, using a protein alignment evolving under the JTT + Γ + I model. Support values (a, bootstrap values; b, posterior probabilities) are indicated next to the corresponding branch. In order to avoid destabilization of the early divergent clades, the identified BELL homologue in Marchantia polymorpha was placed using the evolutionary placement algorithm of RA x ML and the maximum‐likelihood tree as recipient. As a consequence, the M. polymorpha BELL sequence branch is dashed and the associated likelihood weight ratio (Stamatakis, 2014) is indicated in italics. Colour coded boxes correspond to the species phyla. (a) The maximum‐likelihood tree was rooted using the M. polymorpha BELL homologue and (b) the Bayesian tree was rooted using the moss clade.