
Figure 1.
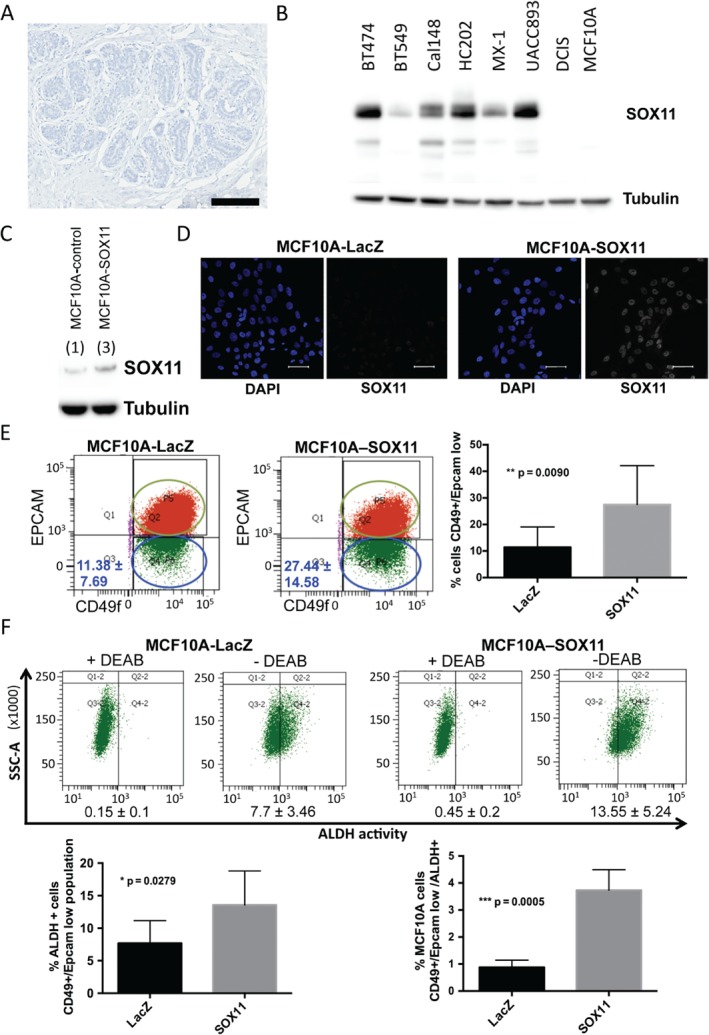
Expression of SOX11 in postnatal mammary epithelial cells alters progenitor cell populations. (A) SOX11 expression was not detected in normal mature breast tissue. Scale bar: 200 μm. (B) SOX11 was expressed in some basal‐like breast cancer and HER2+ cell lines, but not in MCF10A or DCIS.com cells. (C) Western blot of MCF10A‐LacZ control and MCF10A‐SOX11 cells. SOX11 levels (indicated by numerical values) were measured by densitometry, and normalized by dividing by the tubulin values. (D) Immunofluorescence staining of MCF10A‐LacZ control and MCF10A‐SOX11 cells with DAPI (blue in inset) and SOX11 (white). Scale bar: 50 μm. (E) Representative FACS analysis of EpCAM/CD49f‐sorted MCF10A‐control and MCF10A‐SOX11 cell populations. Experiments were performed five times. The average percentage of EpCAM–/CD49f + cells in each population is shown [median ± standard deviation (SD)]. Student's t‐test was performed. (F) ALDH activity levels in MCF10A‐control and MCF10A‐SOX11 cells were detected with the Aldefluor assay. Cells were stained and sorted with CD49f and EpCAM antibodies, and ALDH activity was measured with the Aldefluor kit. Representative ALDH activities after FACS analysis in EpCAM–/CD49f + MCF10A‐control and MCF10A‐SOX11 cell populations are shown. +DEAB plots display the negative control; cells incubated with diethylaminobenzaldehyde (DEAB), the specific inhibitor of ALDH, were used to establish the baseline fluorescence of these cells. Experiments were performed four times, and Student's t‐test was performed. The frequency of EpCAM–/CD49f + basal‐like ALDH+ cells (left graph) and EpCAM–/CD49f+/ALDH+ cells (right graph) in MCF10A‐SOX11 as compared with MCF10A‐LacZ control populations are shown. Error bars represent SD.