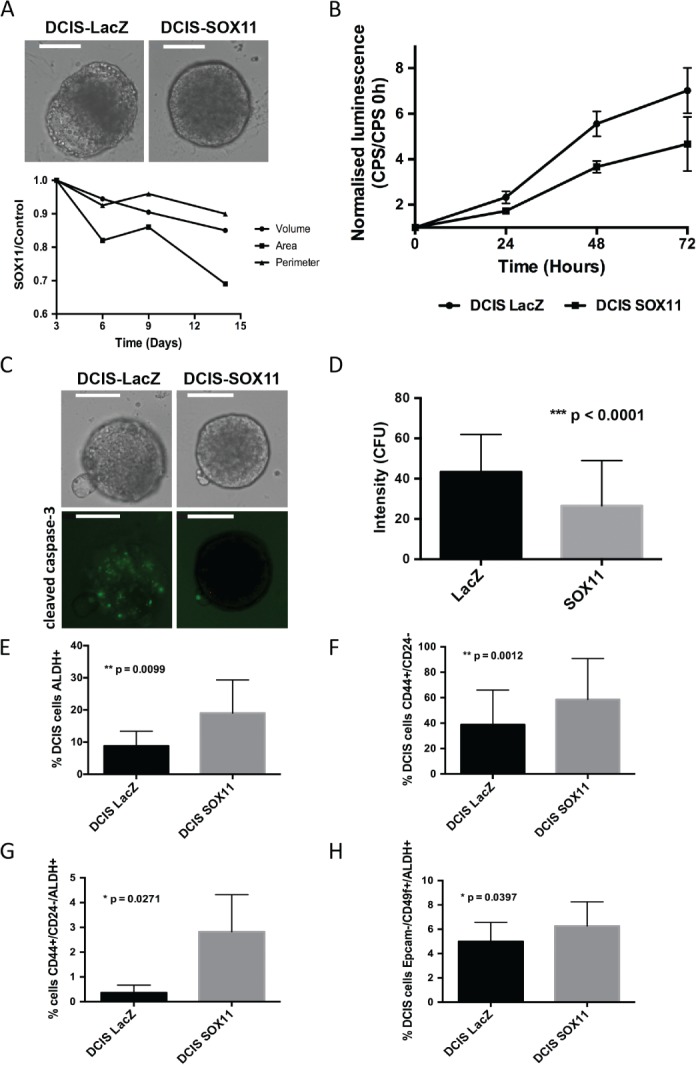
Figure 3.

Effect of SOX11 expression on DCIS cells. (A) Spheroids from DCIS‐LacZ and DCIS‐SOX11 cells at day 14 grown in BME (top images): relative growth curves showing area (μm2), volume (μm3) and perimeter (μm) of DCIS‐SOX11 spheroids as compared with DCIS‐LacZ control spheroids. Scale bar: 200 μm. (B) CellTiter‐Glo assay results of DCIS‐LacZ control and DCIS‐SOX11 cells. Experiments were performed three times (n = 56 in each sample), and Student's t‐test was used for statistical analysis. The values obtained in each time point [counts per second (CPS)] were normalized by dividing by the value obtained at day 0 in each population. P < 0.0001 for the three time points. (C) Representative images of cleaved caspase‐3 activity in spheroids from DCIS‐LacZ control and DCIS‐SOX11 cells 8 days after spheres had formed. Scale bar: 200 μm. (D) Relative cleaved caspase‐3 activity detected in spheroids from DCIS‐SOX11 cells as compared with spheroids from DCIS‐LacZ cells at day 8 [Counts fluorescence units (CFU)]. (E) ALDH activity in DCIS‐control versus DCIS‐SOX11 populations. (F) Frequency of CD44+/CD24– cells in DCIS‐SOX11 as compared with DCIS‐control populations. (G) Frequency of CD44+/CD24–/ALDH+ cells in DCIS‐SOX11 as compared with DCIS‐control populations. (H) Frequency of EpCAM–/CD49f+/ALDH+ cells in DCIS‐SOX11 as compared with DCIS‐control populations. All error bars represent standard deviation.
