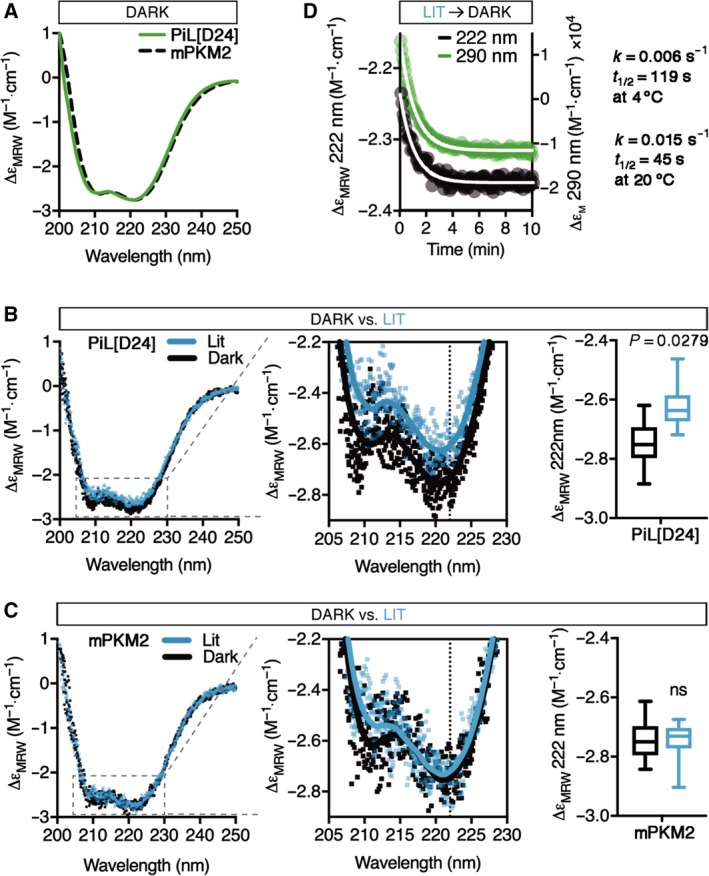
Figure 5.

Light induces conformational changes in PiL[D24] that are synchronous to changes in its fluorescence. (A) Far‐UV CD spectra of purified recombinant PiL[D24] compared to mPKM2 showing indistinguishable secondary structure profiles that are characteristic of α‐helix‐rich proteins. ∆εMRW: extinction coefficient of MRW. (B) Overlay of consecutive single far‐UV CD spectral scans of PiL[D24] before (Dark) and after (Lit) continuous blue light illumination for 2 min, n = 5. Zoom‐in highlights loss of α‐helical CD signal under the Lit condition. Solid lines represent the smoothed average of single scans. The dotted line at 222 nm marks the α‐helical signature CD peak where we observed a significant loss of signal (P = 0.0279, unpaired parametric t‐test) under the Lit condition, as shown on the adjacent bar graph. (C) Overlay of consecutive single far‐UV CD spectral scans or mPKM2 as in (B), acquired and quantified as in (B), n = 5 (P = 0.2320, unpaired parametric t‐test). Zoom‐in shows no loss of CD signal for mPKM2 under Lit condition. (D) Kinetics of secondary structure recovery measured by the CD signal at 222 nm (black circles, right y‐axis) compared to the kinetic of the FMN photoreaction recovery measured at 290 nm (green circles, left y‐axis) after 2 min of blue light exposure at 20 °C. Both signals recover with identical first‐order kinetics (k = 0.015 s−1 and t 1/2=45 s).
