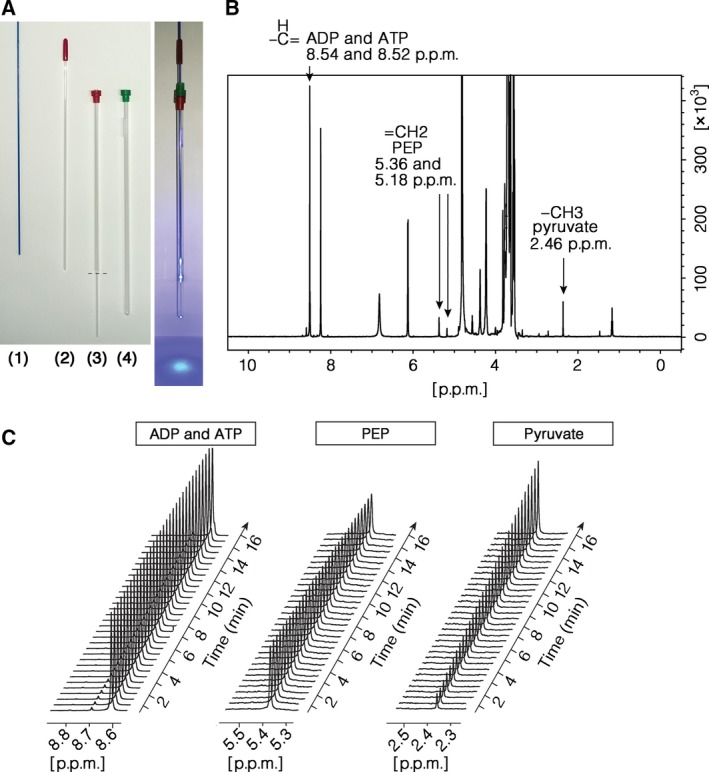
Figure 7.

Monitoring of the pyruvate kinase reaction in real time by NMR. (A) Setup of optic fibre to illuminate the sample in the NMR tube (right picture). The fibre (1) is inserted into an inner tube (2) that is then placed into the coaxial insert (3) with its stem cut off (dotted line). This holds the fibre at the centre of the NMR tube (4). The fully assembled setup with the fibre illuminated is shown on the right picture. (B) 1D 1H NMR spectrum of reactants acquired in Tris/HCl buffer referenced to H2O/D2O and acquired with water suppression. Assigned hydrogens from pyruvate, phosphoenolpyruvate, ADP and ATP are indicated with arrows. (C) The time evolution of pyruvate kinase reaction shown by staged peaks for ADP and ATP, phosphoenolpyruvate and pyruvate extracted from sequential NMR spectra (as in B) that were acquired at 30‐s intervals.
