Figure 8.

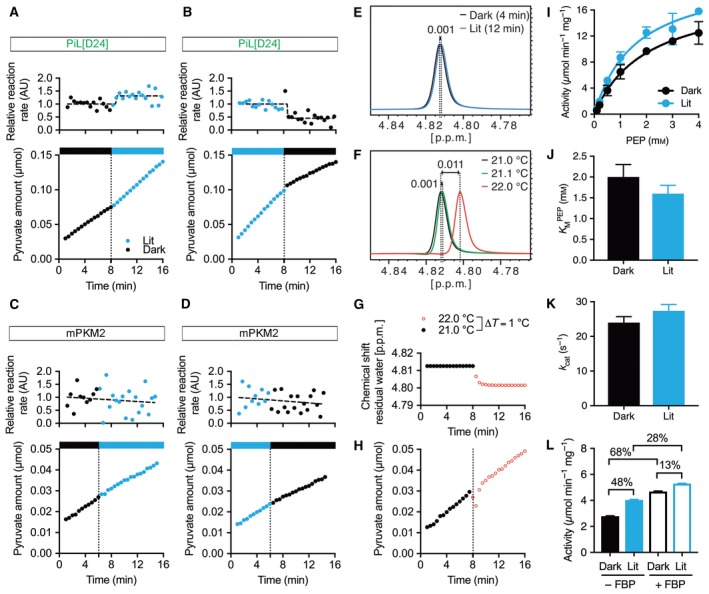
Light induces a reversible increase in the enzymatic activity of PiL[D24]. (A) Pyruvate production in PiL[D24] activity assay, quantified from a time‐resolved series of 1H NMR spectra, before (0–8 min, Dark, black stripe) and after (8–16 min, Lit, blue stripe) switching the blue light on (dotted line at 8 min). The top panel shows reaction rates over time and demonstrates increased activity in the Lit state. (B) Pyruvate production in PiL[D24] activity assay as in (A) but with inverse light conditions, starting the reaction under Lit conditions and switching the light off (Dark). Time‐dependent slopes demonstrate a decrease of activity for withdrawing blue light. (C) Pyruvate production in mPKM2 activity assay as in (A). (D) Pyruvate production in mPKM2 activity assay as in (B). (E) Water peaks from NMR spectra, at 4 min and 12 min, of the experiments shown in (A), showing a change in chemical shift of −0.001 p.p.m. after illumination. See Methods for details on calculating temperature change from the residual water resonance peak shift. (F) NMR spectra of water in the PK reaction buffer without enzymes at the indicated temperatures. (G) Temperature‐dependent change in the chemical shift of water in a PiL[D24] reaction, shown in (H), at 21.0 °C (0–8 min, black filled circles) and after the temperature was increased to 22.0 °C (8–16 min, red open circles). (H) Pyruvate production in PiL[D24] activity assay, quantified from a time‐resolved series of 1H NMR spectra under Dark conditions. The reaction started at 21.0 °C (black filled circles) and progressed for 8 min, at which point (dotted line) the temperature in the NMR tube was increased to 22.0 °C (red open circles). (I) Michaelis–Menten curve fittings (solid lines) of PiL[D24] activity measured with various concentrations of phosphoenolpyruvate ranging from 0.1 to 4 mm under in Lit and Dark state (mean ± SD, P = 0.0059, paired parametric t‐test, n = 3–4 activity measurements for each phosphoenolpyruvate concentration). (J) Bar graph representation of the (mean ± SD) calculated from data shown in (E). Also see Table 3. (K) Bar graph representation of the k cat (mean ± SD) calculated from data shown in (E). Also see Table 3. (L) Activity of PiL[D24] under Dark and Lit conditions in the absence or presence of 100 μm FBP with 1 mm phosphoenolpyruvate (value ± error of the linear fit of activity progress curves from three technical replicates). Percentages show change in activity between the corresponding conditions.
