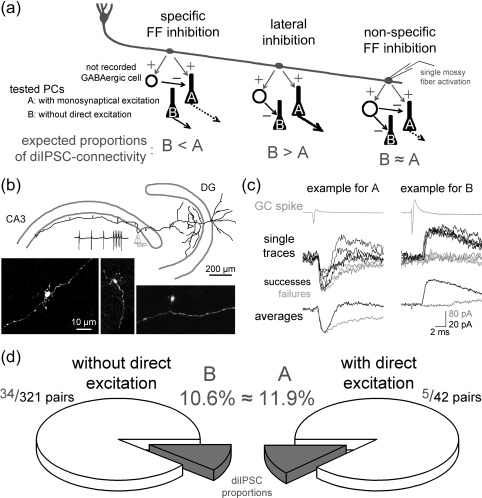
Figure 1.

Wiring of FFI between individual cells of the DG‐CA3 interface. (a) Schematic figure representing the three alternative hypotheses for the possible wiring arrangements of the DG‐CA3 FFI involving individual GCs, PCs, and intermediate FF‐INs with excitatory and inhibitory synaptic connections. The letters A and B depict the two PC groups, which received or lacked monosynaptic EPSCs from the recorded MF track, respectively. The expected relationships between the relative proportions of pairs with diIPSC connections in the three wiring schemes are shown below (e.g., B < A, B > A, B ≈ A). Thicker or, dashed arrows, or the absence of arrows originating from the PCs indicate stronger, temporally structured, or inhibited CA3 PC output, respectively. (b) Drawing of the partially recovered presynaptic axons and dendrites of a DG GC. One of its large terminals was recorded in cell‐attached configuration and was subsequently in whole‐bouton mode to load with biocytin for the anatomical recovery. The presynaptic spikes at two frequencies during cell attached simulation are shown on top. (c) Example traces of MF terminal and PC pairs with diIPSC connectivity only (i.e., positive example for PCs in group B) and with both monosynaptic EPSC and diIPSC connectivity (i.e., group A). The upper gray traces show the average presynaptic action currents in the giant bouton in cell‐attached mode, the middle traces are individual postsynaptic responses or failures, and the trace pairs at the bottom show the averages of all traces with (black) or without (gray) diIPSCs. The morphology of one of the presynaptic GCs (right example) is shown on panel B. For further details about properties of the diIPSCs see Supporting Information Fig. S1 and Table S1. The example traces were recorded with 20 Hz stimulation (for further analyses about the frequency‐dependence of the diIPSCs see Supporting Information Fig. S2). (d) Pie charts summarizing the numbers and probabilities of detecting diIPSCs between single MFs or GCs and PC pairs. The tested PCs either received monosynaptic EPSCs from the stimulated MF (group A, right pie) or lacked direct excitatory connections (group B, left pie). This arrangement led to similar probabilities of finding diIPSCs in the two groups (p = .791, Fisher's exact test). For further analysis using a bootstrapping method see Supporting Information Fig. S3
