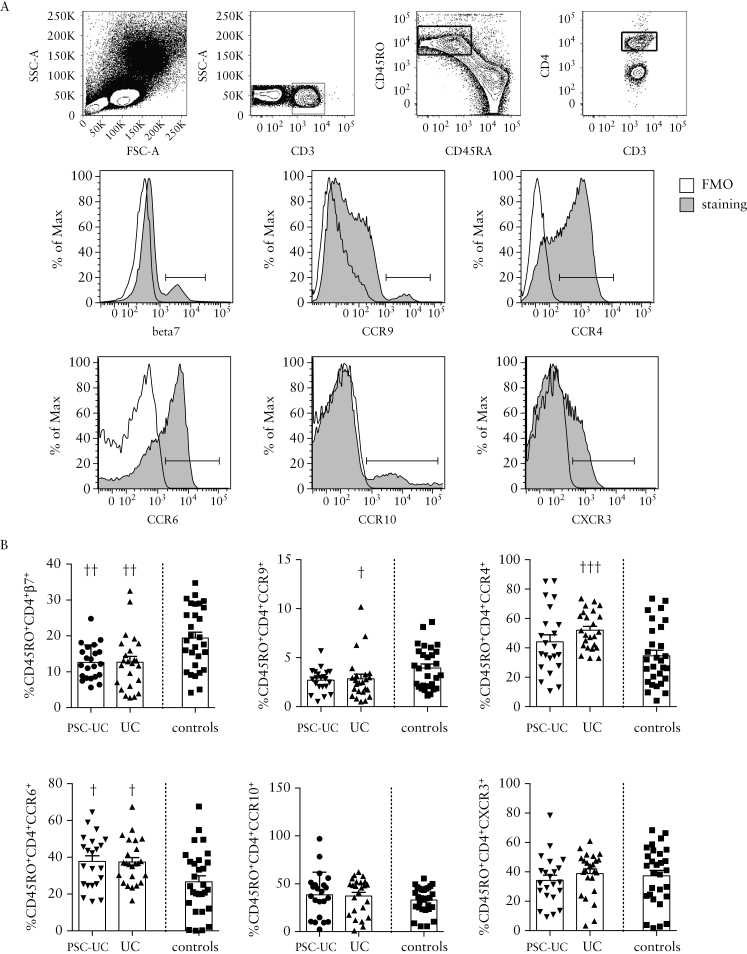
Figure 1.
CCR expression profile of systemic T cells differs between patients with PSC-UC, UC patients, and controls. [A] Representative gating strategy. Cells were gated on lymphocytes, CD3+, CD45RO+CD45RA- memory, CD4+ T cells. β7, CCR9, CCR4, CCR6, CCR10, and CXCR3 staining and FMO controls are shown. [B] Frequency of positive cells among CD45RO+CD4+ cells in patients with PSC-UC, UC, and controls. †P < 0.05, ††P < 0.01, †††P < 0.001, Mann-Whitney test vs controls. CCR, chemokine receptor; PSC-UC, primary sclerosing cholangitis-ulcerative colitis.

