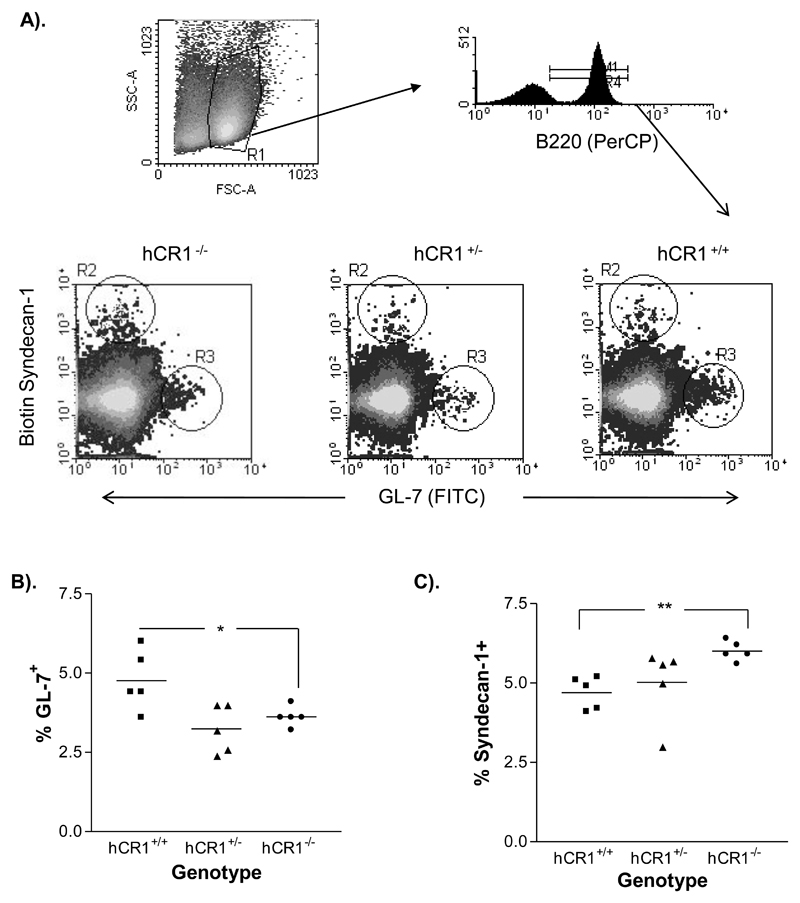
Figure 4. hCR1 mice have altered B cell responses to antigen.
hCR1+/+ (square); hCR1+/- (triangle) and hCR1-/- (circle) F5 intercross mice were immunized with 5x10⁷ SRBC/ml in PBS. After 10 days, splenocytes were isolated and stained for flow cytometry (a) Illustrates the gating strategy used to delineate the germinal center B cells (B220+ Gl-7+) and plasma cells/antibody forming cells (B220+ CD138+); Representative histographs for GL-7 and CD138 expression on B cells from each genotype of mouse analysed are shown. Scatter plot analysis of (b) GL-7+ B cells and (c) syndecan-1 B cells, as a percentage of total B cells in each mouse of a particular genotype are also shown. 10,000 B cells were collected. Groups of 5 mice were analysed. Mann-Whitney U-tests were used to establish significance. **p<0.01, *p<0.05.

