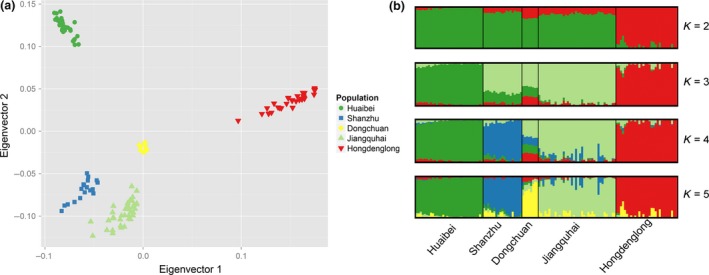
Figure 1.

Analysis of the population structure of five pig populations. (a) Principal components analysis of five pig populations. (b) Population structure of the five tested populations as revealed by structure software. Different colours identify different clusters.
