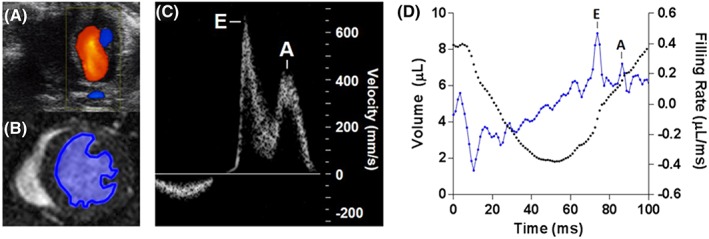
Figure 2.

Representative filling rate curves from the same mouse measured using ultrasound and high‐temporal‐resolution cinematic magnetic resonance imaging (HTR‐CINE MRI) showing early‐filling (E) and atrial/late‐filling (A) peaks. (A) ultrasound image of mitral blood flow showing Doppler measurements overlaid. (B) HTR‐CINE image showing left ventricle blood pool segmentation. (C) ultrasound filling curve of blood velocity through the mitral valve. (D) HTR‐CINE‐derived left ventricle volume curve (black) and filling rate curve (blue)
